 PPT
PPT
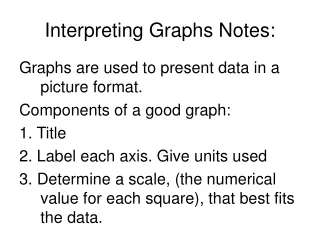
Interpreting Graphs Notes:
Interpreting Graphs Notes:. Graphs are used to present data in a picture format. Components of a good graph: 1. Title 2. Label each axis. Give units used 3. Determine a scale, (the numerical value for each square), that best fits the data. Plot data correctly (x, y)