Statistical Analysis of Data Represented in Non-Euclidean Spaces
Explore the statistical analysis of data represented in non-Euclidean spaces, including methods for modeling, inference, and visualization. Learn about PCA analogs, Frechét means, and open problems in this domain. Discover applications to tree-structured data objects and techniques for classification and discrimination.

Statistical Analysis of Data Represented in Non-Euclidean Spaces
E N D
Presentation Transcript
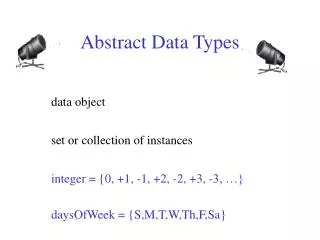
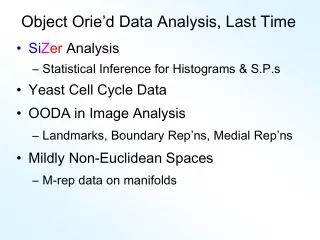
Object Orie’d Data Analysis, Last Time • SiZer Analysis • Statistical Inference for Histograms & S.P.s • Yeast Cell Cycle Data • OODA in Image Analysis • Landmarks, Boundary Rep’ns, Medial Rep’ns • Mildly Non-Euclidean Spaces • M-rep data on manifolds
Mildly Non-Euclidean Spaces Statistical Analysis of M-rep Data Recall: Many direct products of: • Locations • Radii • Angles I.e. points on smooth manifold Data in non-Euclidean Space But only mildly non-Euclidean
Mildly Non-Euclidean Spaces Statistical Analysis of M-rep Data Recall: Many direct products of: • Locations • Radii • Angles Mathematical Summarization: Lie Groups and/or symmetric spaces
Mildly Non-Euclidean Spaces Frechét mean of numbers: Frechét mean in Euclidean Space: Frechét mean on a manifold: Replace Euclidean by Geodesic
Mildly Non-Euclidean Spaces Useful View of Manifold Data: Tangent Space Center: Frechét Mean Reason for terminology “mildly non Euclidean”
Mildly Non-Euclidean Spaces Analog of PCA? Principal geodesics: • Replace line that best fits data • By geodesic that best fits the data • Implemented as PCA in tangent space • But mapped back to surface • Fletcher (2004) Ja-Yeon Jeong will demo in: Bladder – Prostate – Rectum example
Mildly Non-Euclidean Spaces Interesting Open Problems: • Fully geodesic PGA? • E.g. data “just north of equator” on sphere • Gaussian Distribution on Manifold? • Analog of Covariance? • Simulation on Manifold?
Mildly Non-Euclidean Spaces Aside: There is a mathematical statistics literature on “data on manifolds” • Ruymgaart (1989) • Hendriks, Janssen & Ruymgaart (1992) • Lee & Ruymgaart (1996) • Kim (1998) • Bhattacharya & Patrangenaru (2003) …
Strongly Non-Euclidean Spaces Trees as Data Objects From Graph Theory: • Graph is set of nodes and edges • Tree has root and direction Data Objects: set of trees
Strongly Non-Euclidean Spaces Motivating Example: • Blood Vessel Trees in Brains • From Dr. Elizabeth Bullitt • Segmented from MRIs • Very complex structure • Want to study population of trees • Data Objects are trees
Strongly Non-Euclidean Spaces Real blood vessel trees (one person)
Strongly Non-Euclidean Spaces Real blood vessel trees (one person)
Strongly Non-Euclidean Spaces Real blood vessel trees (one person)
Strongly Non-Euclidean Spaces Real blood vessel trees (one person)
Strongly Non-Euclidean Spaces Real blood vessel trees (one person)
Strongly Non-Euclidean Spaces Statistics on Population of Tree-Structured Data Objects? • Mean??? • Analog of PCA??? Strongly non-Euclidean, since: • Space of trees not a linear space • Not even approximately linear (no tangent plane)
Strongly Non-Euclidean Spaces Mean of Population of Tree-Structured Data Objects? Natural approach: Frechét mean Requires a metric (distance) On tree space
Strongly Non-Euclidean Spaces Appropriate metrics on tree space: Wang and Marron (2004) • Depends on: • Tree structure • And nodal attributes • Won’t go further here • But gives appropriate Frechét mean
Strongly Non-Euclidean Spaces PCA on Tree Space? Key Ideas: • Replace 1-d subspace that best approximates data • By 1-d representation that best approximates data Wang and Marron (2004) define notion of Treeline (in stucture space)
Strongly Non-Euclidean Spaces PCA on Tree Space? Also useful to consider 1-d representations In the space of nodal attributes. Simple Example: Blood vessel trees • Just 4 nodes & simplified to sticks • For computational tractability
Strongly Non-Euclidean Spaces 4 node Blood vessel trees - Raw Data
Strongly Non-Euclidean Spaces First PC: Note flipping of root Some images were upside down
Strongly Non-Euclidean Spaces First PC projection plot: Shows all data at one end or other, Nobody near the middle, Where tree was degenerate in movie
Strongly Non-Euclidean Spaces Proposed applications in M-rep world: • Multifigural objects with some figures missing • Multi-object images with some objects missing • … Toy Example: hands with missing fingers
Return to Big Picture Main statistical goals of OODA: • Understanding population structure • PCA, PGA, … • Classification (i. e. Discrimination) • Understanding 2+ populations • Time Series of Data Objects • Chemical Spectra, Mortality Data
Classification - Discrimination Background: Two Class (Binary) version: Using “training data” from Class +1 and Class -1 Develop a “rule” for assigning new data to a Class Canonical Example: Disease Diagnosis • New Patients are “Healthy” or “Ill” • Determined based on measurements
Classification - Discrimination Next time: go into Classification vs. Clustering Supervised vs. Un-Supervised Learning As now done on 10/25/05
Classification - Discrimination Terminology: For statisticians, these are synonyms For biologists, classification means: • Constructing taxonomies • And sorting organisms into them (maybe this is why discrimination was used, until politically incorrect…)
Classification (i.e. discrimination) There are a number of: • Approaches • Philosophies • Schools of Thought Too often cast as: Statistics vs. EE - CS
Classification (i.e. discrimination) EE – CS variations: • Pattern Recognition • Artificial Intelligence • Neural Networks • Data Mining • Machine Learning
Classification (i.e. discrimination) Differing Viewpoints: Statistics • Model Classes with Probability Distribut’ns • Use to study class diff’s & find rules EE – CS • Data are just Sets of Numbers • Rules distinguish between these Current thought: combine these
Classification (i.e. discrimination) Important Overview Reference: Duda, Hart and Stork (2001) • Too much about neural nets??? • Pizer disagrees… • Update of Duda & Hart (1973)
Classification Basics Personal Viewpoint: Point Clouds
Classification Basics Simple and Natural Approach: Mean Difference a.k.a. Centroid Method Find “skewer through two meatballs”
Classification Basics For Simple Toy Example: Project On MD & split at center
Classification Basics Why not use PCA? Reasonable Result? Doesn’t use class labels… • Good? • Bad?
Classification Basics Harder Example (slanted clouds):
Classification Basics PCA for slanted clouds: PC1 terrible PC2 better? Still misses right dir’n Doesn’t use Class Labels
Classification Basics Mean Difference for slanted clouds: A little better? Still misses right dir’n Want to account for covariance
Classification Basics Mean Difference & Covariance, Simplest Approach: Rescale (standardize) coordinate axes i. e. replace (full) data matrix: Then do Mean Difference Called “Naïve Bayes Approach”
Classification Basics Problem with Naïve Bayes: Only adjusts Variances Not Covariances Doesn’t solve this problem
Classification Basics Better Solution: Fisher Linear Discrimination Gets the right dir’n How does it work?
Fisher Linear Discrimination Other common terminology (for FLD): Linear Discriminant Analysis (LDA)
Fisher Linear Discrimination Careful development: Useful notation (data vectors of length ): Class +1: Class -1: Centerpoints: and
Fisher Linear Discrimination Covariances, for (outer products) Based on centered, normalized data matrices: Note: use “MLE” version of estimated covariance matrices, for simpler notation
Fisher Linear Discrimination Major Assumption: Class covariances are the same (or “similar”) Like this: Not this:
Fisher Linear Discrimination Good estimate of (common) within class cov? Pooled (weighted average) within class cov: based on the combined full data matrix:
Fisher Linear Discrimination Note: is similar to from before I.e. covariance matrix ignoring class labels Important Difference: Class by Class Centering Will be important later
Fisher Linear Discrimination Simple way to find “correct cov. adjustment”: Individually transform subpopulations so “spherical” about their means For define
Fisher Linear Discrimination Then: In Transformed Space, Best separating hyperplane is Perpendicular bisector of line between means