Download
1 / 47
470 likes | 689 Vues
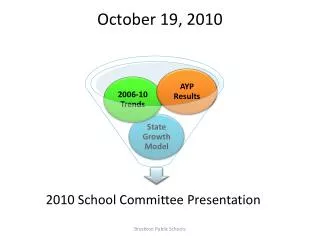
October 19, 2010. 2010 School Committee Presentation. I t d e p e n d s …. How did we do?. 2010 School Committee Presentation. Brockton AYP 2010 Results. T h e C h a l l e n g e o f A Y P : R i s i n g T a r g e t s. MCAS ELA Performance Targets. State. BPS.

E N D
October 19, 2010 2010 School Committee Presentation Brockton Public Schools
It depends… How did we do? Brockton Public Schools
2010 School Committee Presentation Brockton Public Schools
Brockton AYP 2010 Results Brockton Public Schools
TheChallengeofAYP:RisingTargets Brockton Public Schools
MCAS ELA Performance Targets State BPS Brockton Public Schools
MCAS Math Performance Targets State BPS Brockton Public Schools
21 Ways to Miss AYP 3Categories 7 Targets A + (B or C) + D = AYP North Middle School Math Brockton Public Schools
AYPAccomplishments Brockton Public Schools
AYP Challenges Brockton Public Schools
Changes Brockton Public Schools
ELA CPI: Three Different LevelsThree Different Stories Brockton Public Schools
ELA CPI AggregateBPSvs. State State 9.8 9.3 BPS Brockton Public Schools
ELA CPI by Grade Band 2010 -2.4 5 Gain -2 7.3 Gain +1 -1.2 Decline Brockton Public Schools
2006-10 ELA CPI Gain/Loss by Grade Level 5.8 Gain 6.7 Gain Elementary Losses Small Gain Secondary Grade Gains Brockton Public Schools
2010 ELA Gains + 2.4 + .4 + 1 Brockton Public Schools
Grade 3 ELA Reversal? 2010 Outgains State 2.4 Gain 3.2 Gain -2.4 Loss 5.6 Gain BPS State Brockton Public Schools
Grade 8 ELA 1 Year Regression: 5 Year Positive Trend -4.4 13.2 8.8 Gain Brockton Public Schools
2010 ELA CPA Aggregate .3 Gap 9.8 Gap Brockton Public Schools
ELA Subgroup Gain 2006-10 BPSvsState 10.8 2.4 Brockton Public Schools
2010 ELA Subgroup BPS vsState 75.1 Brockton Public Schools
BPSvsStateSWD 2006-10 ELA Gain: Why We Drill Down Elementary Down Secondary Higher Brockton Public Schools
Math CPI AggregateBPS vs. State State 13 11.6 BPS Brockton Public Schools
Math CPI by Grade Band 2010 -.6 9.4 Gain -.6 4 Gain +.2 9.8 Gain Brockton Public Schools
Gain/Loss 2006-10 by Grade Level Larger Gains + 3.5 + 7 Smaller Gains Gains + .6 Decline Brockton Public Schools
2010 Math Gains +.1 +.5 Area of Concern Brockton Public Schools
Grade 3 Math 1 Year Improvement:Overall Trend is Down 2006-10 3.9 Loss 1 Year 1.7 Gain Brockton Public Schools
2010 Math CPI Aggregate 1.9 Gap 13 Gap Brockton Public Schools
Math Subgroup Gain 2006-10 BPSvsState LEP Brockton Public Schools
2010 Math Subgroup BPSvsState Brockton Public Schools
BPSvsStateSWD 2006-10 Grade Level Gain Overall Gain Elementary Concerns Secondary Gains Brockton Public Schools
2006-2010 Trends Brockton Public Schools
State Growth Model: Student Growth Percentile (SGP) Brockton Public Schools
Growth to grade 7: Three students • Academic Peer Groups English language arts Grade 5 2008 Grade 6 2009 Grade 7 2010 SGP 20010 Peter 230 234 230 35 Paul 248 246 244 25 Mary 214 214 226 92
35 Interpreting Student Growth Percentiles Peter’s SGP was 35. His score was higher than 35% of his academic peers (and lower than 65%). • Is that amount of growth typical? Lower growth Typical growth Higher growth Percent of students Brockton Public Schools
Seeking the Northeast Quadrant Per formance Growth (SGP) Brockton Public Schools
ELA Scatterplot Pe r f o rmance Growth Brockton Public Schools
Math Scatterplot Pe r f o rmance Growth Brockton Public Schools
ELA SGP Brockton Public Schools
Math SGP Brockton Public Schools
2008-10 SGP Trend Summary Brockton Public Schools
Conclusions Brockton Public Schools
Brockton Public Schools Data Presentation 2010 October 19, 2010 Dr. Ethan R. Cancell School Committee Mayor Linda M. BalzottiChair Ward One Thomas J. Minichiello, Jr. Vice-Chair Ward Two Richard E. Bath Ward Three Janice A. Beyer Ward Four Patricia A. Joyce Ward Five William Carpenter Ward Six James M. Daley Ward Seven Timothy J. Sullivan SuperintendentMatthew H. Malone, Ph.D. Secretary Brockton Public Schools
END 2010 School Committee Presentation Brockton Public Schools