Download
1 / 25
250 likes | 466 Vues
Measuring Quality of Service on Worker Node in Cluster. Rohitashva Sharma, R S Mundada, Sonika Sachdeva, P S Dhekne, Computer Division, BARC, Mumbai, India Helge Mainhard, Tony Cass, Olof Barring, CERN Geneva, Switzerland. INTRODUCTION. Quality of Service

E N D
Measuring Quality of Service on Worker Node in Cluster Rohitashva Sharma, R S Mundada, Sonika Sachdeva, P S Dhekne, Computer Division, BARC, Mumbai, India Helge Mainhard, Tony Cass, Olof Barring, CERN Geneva, Switzerland CHEP 06
INTRODUCTION • Quality of Service • Defines goodness of a node for a type of task • Needed for better/optimum utilization of resources • Computer Division, BARC and IT Division CERN collaborated to explore ways to predict QoS CHEP 06
Texecution = Wall clock execution time for any task Tnoload = Wall clock execution time of the task on a given node without load QoS = Quality of Service QoS – Definition • QoS defines, how better the node is for a given task • QoS relates execution times like this • QoS varies between 0 to 1 CHEP 06
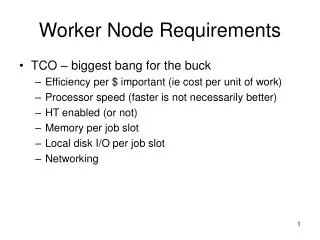
Methodology • Three task categories • CPU intensive • Disk IO intensive • Network IO intensive • Representative probe programs for each category • Load generating program for each category CHEP 06
Methodology • Monitor system metrics • Load avg, CPU utilization, Memory utilization, disk utilization, swap utilization etc. • Execute probe programs in different load conditions (generated using load generating programs) • Correlate probe execution time, system metrics and no load execution time of probe CHEP 06
Probe Selection • Probe should • Represent real world applications • Have less execution time • Non-interactive • Selected probes are • Linpack for CPU intensive • Bonnie for Disk IO intensive • Network IO intensive (not considered) CHEP 06
Load Generating programs • Generate load in given category • Should have large execution time • Feature for varying the load • Two type of Disk IO load • Block IO (IO in large data blocks) • Character IO (IO in small data blocks) CHEP 06
SETUP • 32 node cluster • Each node consists of • P4@1.6 GHz • 640 MB memory • 40 GB HDD • Redhat Linux version 7.3 • EDG Fabric Monitoring System for gathering system metrics CHEP 06
(Equation 1) CPU Probe • CPU probe in different loading conditions • Correlation using load average • Execution time varies linearly with load average • Problem in block IO load CHEP 06
CPU Probe CHEP 06
CPU Probe • Load average represents combined CPU and IO load • CPU probe depends only on CPU load • Two ways to achieve it • Average CPU load (VmStatR) • Calculate available CPU to probe CHEP 06
(Equation 2) CPU Probe • Average CPU Load • 1 minute running average of run queue • Called VmStatR • Predicted QoS will be CHEP 06
CPU Probe CHEP 06
(Equation 3) CPU Probe • Available CPU to probe • Calculate using CPU utilization metric • Probe is eligible for • Available Idle time • A share of System and User time CHEP 06
CPU Probe • Table shows the comparison between QoS predicted using equation 1 & 3 in Block IO load • QoS using Eq. 3 shows correct characteristic CHEP 06
Comparison of results • Compare the QoS results obtained using the three equations for CPU probe in different loads • Equation 1 does not give correct prediction in block IO load conditions • Equation 2 & 3 give acceptable results in any load condition CHEP 06
CPU Probe – Comparison of results LC – CPU Load LC+LB – CPU + Block IO Load LC + LCh – CPU + Character IO Load LCh + LB – Character + Block IO Load CHEP 06
Disk IO Probe • Modified ‘Bonnie’ to perform both as block IO and character IO probe • Considered block IO probe as most of the applications were block IO intensive • Correlate execution time probe under different loading conditions • Predicted QoS using the three equations and compared results CHEP 06
Disk IO Probe – Comparison of results LC – CPU Load LC+LB – CPU + Block IO Load LC + LCh – CPU + Character IO Load LCh + LB – Character + Block IO Load CHEP 06
CMSIM Results • Predicted execution time using QoS from Equation 2 • % error against the measured one acceptable CHEP 06
Problem Areas • Effect of swapping • If available memory is less than the size of task • Linux kernel dynamically changes the priorities of tasks and swaps tasks accordingly • Difficult to predict QoS CHEP 06
Problem Areas – Swapping CHEP 06
Problem Areas • Metric sampling frequency of monitoring system • Immediate metric value ensures better QoS prediction • At higher sampling frequency monitoring loads the node • Change in state after submission of task • QoS can’t consider load changes after submission of task • Submission/removal of other task may change QoS CHEP 06
Conclusion • Equation 2 & 3 provides better QoS for CPU bound applications • Equation 1 can be used for IO bound applications • Successfully predicted for CMSIM – It is mostly cpu bound job • Load balancing programs can use derived equations for job submissions CHEP 06
Thanks CHEP 06