3. Trend Analysis
2006 AGU Fall Meeting: B13A-1060 Insights on Human Impacts on the Environment From Spatial Variation in Stable Isotope Ratios.

3. Trend Analysis
E N D
Presentation Transcript
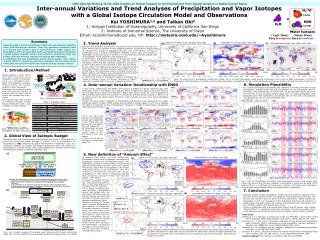
2006 AGU Fall Meeting: B13A-1060 Insights on Human Impacts on the Environment From Spatial Variation in Stable Isotope Ratios Kei YOSHIMURA1,2 and Taikan Oki21: Scripps Institution of Oceanography, University of California San Diego2: Institute of Industrial Science, The University of TokyoEmail: k1yoshimura@ucsd.edu, HP: http://meteora.ucsd.edu/~kyoshimura Inter-annual Variations and Trend Analyses of Precipitation and Vapor Isotopes with a Global Isotope Circulation Model and Observations Summary 3. Trend Analysis (b) (c) (a1) Observed global monthly precipitation isotope data are analyzed regarding trend, and inter-annual variation. There are significant increasing trend over Europe and northern part of North America. ENSO signals are remarkable in DJF over Greenland, North and South Americas and Australia. A global isotope circulation model, that consists of atmosphere, land, sea surface, and river modules, captures the features quite reasonably. A relationship with local precipitation amount and its isotopic ratio, namely “Amount Effect”, is revised by using their anomalies. The new index covers whole globe and could more efficiently interpret isotopic records in nature. Dirmeyer and Brubaker (2006) show increasing trend of precipitation recycling over North America due to increase of local evapotranspiration. Precipitation isotopes may be influenced by change of regional hydrologic cycle. Theoretically, increase of precipitation (so as moisture convergence) depletes isotopic ratio, and increase of evaporation (so as local source of moisture, i.e., recycling ratio) enriches isotopic ratio in precipitation. There should be a like between two. In observation, precipitation isotopes in Europe and South America shows increasing trend (Fig.4a2), and the model reproduces them (Fig.4b). However, significant increase in northern North America and decrease in east Asia are missed by the model. The model shows significant increasing trends North-East Eurasia, NW USA, Sumatra, and northern part of central Africa, and decreasing trends in tropical oceans (All Pacific, Atlantic, and Indian), Java, and southern part of central Africa, but there are no observations to compare. In Tropics, the trends of precipitation amount dominates the trends of isotope (figure not shown). Brubaker’s (1993) method of recycling ratio is shown as a supplement (Fig.4c). (a2) 1. Introduction/Method Stable isotopes in water (H218O and HDO) inherently have integrated record of hydrologic cycle, e.g., atmospheric proc-esses in precipitation isotopes. However, there still remains mystery of their mechanism. This study tries to analyze trends and inter-annual signals of monthly data by GNIP, and to reveal the mechanism with a model. The original model, that consists of 4 modules, simulates 15-year isotopic distribution with 1 deg. resolution, forced by ERA15. Fig.4: 15 years trend of precipitation isotope ratio (delta-18O) in (a) GNIP observation (West Eurasia is zoomed in (a1)) and (b) ERA15 simulation. (c) Trend of Brubayker’s (1993) definition of monthly recycling ratio. Seasonality is excluded for all figs. >99% significant are shown as circles in (a) and thick lines in (b) and (c). 6. Simulation Plausibility 4. Inter-annual Variation: Relationship with ENSO (b1) (b2) Fig.7 shows climatological seasonality and variations in monthly anomalies in both precipitation isotopes (delta-18O) and precipitation for the observation and the simulation. Only selected sites are shown here, but the simulated results quite fit to the observed. All over the globe, simple isotopic ratio in monthly precipitation (with seasonality) are >90% significantly correlated at 267 over 331 sites, and anomalies are significant at 156 over 226 comparable sites. In this section, relationships with ENSO (SST anomaly at NINO3) are shown. Observed data show Greenland, center of the Pacific, and equatorial Africa as ElNino-low regions, and South America, south of Asia, North America, and Australia in ElNino-high regions in DJF. JJA is not as apparent as DJF, but ElNino-high locates over Australia. In simulations, the inter-annual contrast is clearer; most of regions except the African region (Fig.5c1-4). Vapor isotopes are even more clearly distributed (Fig.5b1-2). Overall, the inter-annual variability of precipitation isotopes are well-captured by the model. Significant pattern of vapor (TPW) isotope and precipitation isotope appear in DJF. In low latitude, the pattern corresponds to that of precipitation. However, in middle to high latitude, precipitation plays less (fig not shown). Fig.1: Schematic of simulation (a1) (a2) Table 1: Simulation Spec. (a1) (a2) (c1) (c2) Fig.5: (a) Observed anomaly of precipitation isotope ratio (delta-18O) of (a1) ElNino-DJF, (a2) LaNina-DJF, (a3) ElNino-JJA, (a4) LaNina-JJA. (b) Simulated anomaly of delta-18O in total column vapor in (b1) DJF ElNino and (b2) LaNina. (c) Same as (a) but for simulated precipitation delta-18O. (b1) (b2) Fig.2: Annual mean delta-18O in precipitation by GNIP observation (a3) (a4) (c3) (c4) (c1) (c2) 2. Global View of Isotopic Budget Simulated water and isotope budgets over the globe are shown in Fig.3a and 3b. It should be noted that global average of isotopic ratio in precipitation (or evaporation) is NOT influenced by global enhancement of hydrologic cycle. It is influenced, however, by isotopic fractionation parameters which are sensitive to temperature or humidity change. Also, global distribution of isotopes would change dramatically by change of regional hydrologic cycle. (d1) (d2) (a) 5. New definition of “Amount Effect” In monthly time scale, it is well known that precipitation isotope ratio is negatively correlated with precipitation amount over low latitudinal regions. The relationship is called as “Amount Effect”. Fig.6a shows observed relationship. However, over those regions with strong seasonality of precipitation, this simple relationship gives us few information. One who observes precipitation isotopes may think, “precipitation in rainy season is isotopically depleted than dry season, because of more rain than dry season… Then what?”. (b) (a) (e1) (e2) Blue: Sim (79-93),Red: Obs, Pink: Obs-P,Green: Sim-P To make the isotopic informa-tion more informative, season-ality of both precipitation and isotopes should be removed. Fig.6c shows correlation bet-ween anomalies of precipitation amount and isotope ratio. Not only lower latitudinal regions, but also Europe and other high latitudinal regions becomes negative relationship (Fig.6c). Therefore, anomaly of isotope ratio in monthly precipitation is good indicator (or interpreter) of monthly anomaly of precipi-tation over the most of the world. This makes isotopic More information than before: Monthly precipitation can be reproduced from old monthly precipitation isotope record. Model results well reproduce the relationships, including no correlation over northeast of N. America and center of Siberia (through Arctic ocean). Fig.7: (a1-e1) Climatology of monthly mean precipitation amount and isotope ratio (delta-18O) and (a2-e2) monthly variations in anomalies of precip and its delta-18O at selected sites, i.e. (a) Ottawa, (b) Hong Kong, (c) Berlin, (d) Midway, and (e) Brisbane. Pink and blue zones indicate ElNino and LaNina periods, respectively. 7. Conclusion (b) (d) (c) Observed global monthly precipitation isotope data are analyzed regarding trend, and inter-annual variation. There are significant increasing trend of the data over Europe and northern part of North America particularly. ENSO signals are remarkable in DJF over Greenland, North and South Americas and Australia. A global isotope circulation model, that consists of atmosphere, land, sea surface, and river modules, captures the features quite nicely. Finally, a relationship with local precipitation amount and its isotopic ratio, namely “Amount Effect”, is revised as using their anomalies. Thus the new index covers whole globe and would become more useful to interpret isotopic records in nature. Previous δP=A x P + B New ΔδP=C x ΔP + D References: Yoshimura, K., S. Miyazaki, S. Kanae, and T. Oki, Iso-MATSIRO, a land surface model that incorporates stable water isotopes, Glob. Planet. Change, 51, 90-107, 2006. Yoshimura, K., T. Oki, and K. Ichiyanagi, Evaluation of two-dimensional atmospheric water circulation fields in reanalyses by using precipitation isotopes databases, J. Geophys. Res., 109(D20), doi:10.1029/2004JD004764, 2004. Brubaker, K.L., D. Entekhabi, and P.S. Eagleson, Estimation of continental precipitation recycling, J. Clim, 14, 2497-2508, 1993. Dirmeyer, P.A. and K.L. Brubaker, Evidence for trends in the Northern Hemisphere water cycle, Geophys. Res. Let., 33, L14712, doi:10.1029/2006GL026359, 2006. Acknowledgment: This research is funded by JSPS, JST, and GEOSS Mostly Negative Correlation! Fig.6: Correlation coefficient between monthly precipitation amount and its isotope ration (delta-18O) in (a) GNIP observation for 1950-2001 and (b) simulation for 1979-1993. Similar correlation between both anomalies of P and delta-18O in P are shown in (c) for observation and (d) for simulation. Observation in europe are zoomed. Fig.3: (a) 15-year average of the global water balance with isotopic information (delta-18O). (b) More detail of 15-year averaged water and isotope cycle on the Earth.