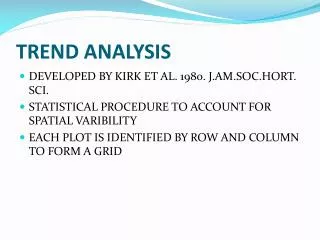
Trend Analysis
Trend Analysis. Step vs. monotonic trends; approaches to trend testing; trend tests with and without exogeneous variables; dealing with seasonality; Introduction to time series analysis; Step trends. Testing for Trends. Purpose:

Trend Analysis
E N D
Presentation Transcript
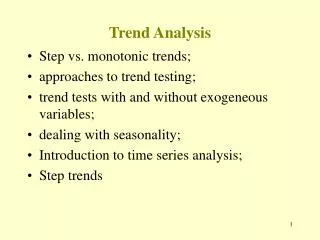
Trend Analysis • Step vs. monotonic trends; • approaches to trend testing; • trend tests with and without exogeneous variables; • dealing with seasonality; • Introduction to time series analysis; • Step trends
Testing for Trends Purpose: To determine if a series of observations of a random variable is generally increasing or decreasing with time Or, has probability distribution changed with time? Also, we may want to describe the amount or rate of change, in terms of some central value of the distribution such as the mean of median.
Monotonic Trend vs. Step Trend-Some Rules SituationMonotonicStep Long record with a known event that naturally X divides the period of record into a “pre” and “post” period. Record broken into two segments with a long X gap between them. Unbroken or nearly unbroken long record X Multiple records with a variety of lengths and X timing of data gaps. Unbroken record that shows a sudden jump in X magnitude of r.v. for no known season.
Approaches to Monotonic Trend Testing • Where Y = r.v. of interest in the trend test (e.g. conc., biomass, etc.) X = an exogenous variable expected to affect Y, (e.g. flow rate, etc.) R = residuals from a regression or LOWESS of Y vs. X T = time (often expressed in years)
Trend tests with No Exogenous Variable • Nonparametric Mann-Kendall test same test as Kendall’s (discussed in the next few slides) test is invariant to power transformation. Kendall’s S statistic is computed from the Y, T data pairs. H0 of no change is rejected when S (and therefore Kendall’s of Y vs T) is significantly different from zero. If H0 rejected, we conclude that there is a monotonic trend in Y over time T.
Kendall’s Tau (t) • Tau (t) measures the strength of the monotonic relationship between X and Y. Tau is a rank-based procedure and is therefore resistant to the effect of a small number of unusual values. • Because t depends only on the ranks of the data and not the values themselves, it can be used even in cases where some of the data are censored. • In general, for linear associations, t < r. Strong linear correlations of r > 0.9 corresponds to t > 0.7. • Tau - easy to compute by hand, resistant to outliers, measures all monotonic correlations, and invariant to power transformations of X or Y or both.
Computation of Tau (t) • First order all data pairs by increasing x. If a positive correlation exists, the y’s will increase more often than decreases as x increases. • For a negative correlation, the y’s will decrease more than increase. • If no correlation exists, the y’s will increase and decrease about the same number of times. • A 2-sided test for correlation will evaluate: • Ho: no correlation exists between x and y (t = 0) • Ha: x and y are correlated (t 0)
The test statistic S measures the monotonic dependence of y on x: • S = P - M • where : P = # of (+), the # of times the y’s increase as the x’s increase, or the # of yi < yj for all i < j. • M = # of (-), the # of times the y’s decrease as the x’s increase, or the number of yi > yj for all i < j. • i = 1, 2, … (n-1); and j = (i+1), …, n. • There are n(n-1)/2 possible comparisons to be made among the n data pairs. If all y values increased along the x values, S = n(n-1)/2. In this situation, t = +1, and vice versa. Therefore dividing S by n(n-1)/2 will give a -1 < t < +1.
Hence the definition of t is: • To test for the significance of t, S is compared to what would be expected when the null hypothesis is true. If it is further from 0 than expected, Ho is rejected. • For n <= 10, an exact test should be computed. The table of exact critical values is given in Table 1. For n > 10, we can use a large sample approximation for the test statistic.
Large sample approximation - t • The large sample approximation Zs is given by: • And, Zs = 0, if S = 0, and where: • The null hypothesis is rejected at significance level a if Zs > Zcrit where Zcrit is the critical value of the standard normal distribution with probability of exceedence of a/2.
Example:10 pairs of x and y are given below, ordered by increasing x:y : 1.22 2.20 4.80 1.28 1.97 1.46 2.34 2.64 4.84 2.96 x: 2 24 99 197 377 544 3452 632 6587 53170 Outlier x y
To compute S, first compare y1 = 1.22 with all subsequent y’s. • 2.20 > 1.22, hence + • 4.40 > 1.22 hence +, etc. • Move on to i=2, and compare y2 =2.20 to all subsequent y’s. • 4.80 > 2.20, hence + • 1.28 < 2.20 hence -, etc. • For i=2, there are 5 +’s and 3 -’s. It is convenient to write all + and - below their respective yi, as shown on the next slide. • In total there are 33 +’s (P=33) and 12 -’s (M=12). Therefore: • S=33-12 = 21, and there are 10(9)/2=45 possible comparisons, so t = 21/45 = 0.47. From Table 1, for n = 10 and S=21, the exact p-value is 2(0.036) = 0.072.
Table of + and - signs • yi : 1.22 2.20 4.80 1.28 1.97 1.46 2.64 2.34 4.84 2.96 • + + - + - + - + - • + - - + + + + + • + - - + + + + • + - - + + + • + + - + + • + + + + • + + - • + + • + • 33 (+) and 12 (-), S = 33-12 = 21
Large sample approximation • The large sample approximation is: • From the Table of normal distribution, the 1-sided quantile for 1.79 = 0.963, so that p=2(1-0.963) = 0.074 • The large sample approximate is quite good even for a small sample of size 10.
Kendall-Theil Robust Line (Non-parametric) • The K-T Robust line is related to Kendall’s correlation coefficient tau ( ) and is applicable when Y is linearly related to X. • This line is not: • dependant on the normality of residuals for the validity of significant tests, • strongly affected by outliers. • The Kendall-Theil line is of the form:
This line is closely related to Kendall’s t, in that the significance to the test for H0: slope is identical to the test for H0: . • The slope estimate is computed by comparing each data pair to all others in a pairwise fashion. • The median of all pairwise slopes is taken to be the non-parametric estimate of slope . • The intercept is defined as follows: for all i < j
Where Ymed and Xmed are the medians of X and Y. The formula assures that the fitted line goes through the point (Ymed, Xmed). This is analogous to OLS, where the fitted line always goes through the means of X and Y. Example 1: Given the following 7 data pairs: There are n(n-1)/2 pairs
Test of Significance • The test is identical to Kendall’s t. That is, first compute S, then check Table 1 if n < 10, or use large sample approximation for n > 10. • For the example, S=20-1=19, and there are 21 pairwise slopes. t=19/21=0.90. From Table 1, with n=7 and S=19, the exact 2-sided p-value is 2(0.0014)=0.003 • Note: If the Y value was 60 instead of 16, a clear outlier, the estimate of the slope would not change. This shows that the Kendall-Theil line is resistant to outliers.
Parametric Regression of Y on T Simple regression of Y on T is a test for trend. H0 is that the slope coefficient 1 = 0. All assumptions of regression must be met - normally of residuals, constant variance, linearity of relationship, and independence. Need to transform Y if assumptions not met. If H0 is rejected, we conclude that there is a linear trend in Y over time T.
Comparison of Simple Tests for Trends If regression assumptions are OK, then regression is best. Also good if there are more that one exogenous variable. If assumptions of regression not met (outliers, censored, non-normal, etc.) Mann-Kendall will be OK or better. Transformation of Y will affect regression, but not Mann-Kendall. Best to try both methods.
Accounting for Exogenous Variables Exogenous variable - variable other than time trend that may have influence on Y. These variables are usually natural, random phenomena such as rainfall, temperature or streamflow. Removing variation in Y caused by these variables, the background variability or “noise” is reduced so that any trend “signal” present is not masked. The ability of a trend test to discern changes in Y with T is then increased.
Removal process involves modelling, and thus explaining the effect of exogenous variables with regression or LOWESS. When removing the effect of one or more exogenous variables X, the probability distribution of the X’s is assumed to be unchanged over the period of record. If the probability distribution of X has changed, a trend in the residuals may not necessarily be due to a trend in Y. Need to be careful of what is chosen as exogenous variable.
Nonparametric approach - LOWESS LOWESS - describes the relationship between Y and X without assuming linearity or normality of residuals. LOWESS pattern should be smooth enough that it doesn’t have several local minima and maxima, but not so smooth as to eliminate the true change in slope. LOWESS residuals: Then, Kendall S statistic is computed from R and T pairs to test for trend.
Mixed Approach: First do regression of Y on X (can have more than one X). Check all regression assumption: normality, linearity, constant variance, significant 1, etc. Then residuals (from regression) Then Kendall S is computed from R, T pairs to test for trend.
Parametric approach Uses regression of Y on T and X in one go. This test for trend and simultaneously compensates for the effects of exogenous variables. Must check for assumptions of regression. If 1 is significantly different from zero, then there is trend. 2 should be significant as well. Otherwise no point including X.
Comparison of approaches Use LOWESS if there is nonlinearity. No need to check assumptions closely when using LOWESS. No need to transform data to achieve linearity with LOWESS. If assumptions of regression OK, then regression is a one-step process with maximum efficiency.
Dealing with Seasonality Different seasons of the year may be a major source of variation in the Y variable. As with other exogenous variable, seasonal variation must be compensated for or “removed” in order to better discern the trend in Y over time. May also be interested in modelling seasonality to allow predictions of Y for different seasons.
Nonparametric method: Seasonal Kendall Test (Method 1) Accounts for seasonality by computing Mann-Kendall test on each of m seasons separately, then combining the results. For monthly seasons, January data are compared only with January, February only with February, etc.
If Sk > 0 If Sk = 0 If Sk < 0 If product of number of years and number of seasons > 25, normal distribution can be used. If |Zsk| > Zcrit then reject null hypothesis of no trend. Zcrit = 1.96 for =0.05.
Estimate of trend slope Trend slope of Y over time T = median of all slopes between data pairs within the same season. No cross season slopes contribute to the overall estimate of the Seasonal Kendall trend slope. Exogenous Variable Use LOWESS of Y on X to get R, then apply Seasonal Kendall on R, T.
Mixture MethodsMethod 2a Apply seasonal Kendall test to R from a regression of Y on X. Must check for violation or regression assumptions. Method 2b Deseasonalize data by subtracting seasonal medians from all data within the season, and then regressing deseasonalized data against T. Less power to detect trend.
Parametric Method (Method 3) Multiple regression with periodic functions to describe seasonality. Other terms = exogenous variables or dummy variables. If 3 is significant, then there is trend. The term 2T = 6.2832.t When t is in years. = 0.5236.m When m is in months = 0.0172.d When d is in days.
Comparison of methods Mann-Kendall and mixed approaches applicable to univariate data. Cannot be used for multiple Xs. Good for nonnormal data. Multiple regression does it all in one swoop. Fewer parameters but constrained by functional form (sine and cosine). Need close checking of regression assumptions. Can provide seasonal summary statistics.
Introduction to Time Series Analysis When the Y or R values are dependent in time (auto or serial correlation). Two purposed: a) Modelling and Simulation b) Forecasting Modelling and Simulation: ARIMA, Fourier + ARMA, Dynamic Regression Forecasting: ARIMA, Exponential Smoothing, Dynamic Regression (Need a separate course to cover this topic) E.g.
Summary • First decide the type of trend to be analyzed • step vs monotonic • check assumptions • nonparametric vs parametric • Are there exogenous variables? • Remove them first or model in one go • Seasonality? • Always plot the data - Boxplots, X-Y plots are most useful.