Crow Behavior and Population Dynamics Study: Assignments and Resources for Biology 356
Engage in a hands-on study of crow behavior and population dynamics through the latest assignments posted on the course website. Calculate total population using mark-recapture statistics and design your own small study to test a hypothesis regarding crow distribution. Access invaluable materials online, including Q&A self-tests and chapters from "Living Graphs" to deepen your understanding of ecological concepts such as convergence, intertidal zonation, and life histories. Don't forget to consult your TA for guidance!

Crow Behavior and Population Dynamics Study: Assignments and Resources for Biology 356
E N D
Presentation Transcript
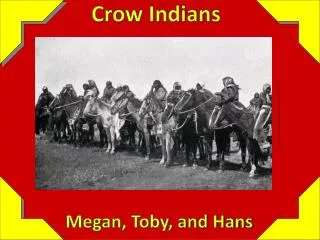
Update on crow assignment • Class data are posted, courses.washington.edu/bio356 on the Assignments page • Calculate total population based on mark-recapture statistics • Design and carry out a small study to examine a hypothesis about crow behavior or distribution – check with your TA!!!!!!!
Studying course material • www.whfreeman.com/ricklefs • Q&A online self-tests (no need to enter any identification) • For population dynamics in particular, explore Living Graphs (Ch 14) over the next week
Biomes include habitats in different locations that contain different species with similar adaptations • Convergence = process by which unrelated organisms evolve a resemblance to each other in response to common environmental conditions Fig 5.1
River continuum concept • As water flows downhill, physical and chemical properties change, and so does community composition • Water flow slows (less steep) • Warmer water (wider, so vegetation farther away) • More nutrient rich (most nutrients in rivers have to fall in) • In small streams, lots of shredders; down farther, lots of scrapers (of algae growing on rocks) and collectors (particles)
Intertidal zonation • At shoreline zones higher above the low water mark, temperature and desiccation change, and so does community structure
Intertidal zonation • Different species dominate different tidal elevations • Space occupants include algae and sessile (non-moving) invertebrates • Dramatic shifts in species composition occur over short spatial scales
Patterns in the distribution and abundance of species • Depend on history • Abiotic conditions • Biotic interactions • Each step is a “filter” helping to determine local community structure Which species can survive the local physical conditions?
Test your knowledge • What do you expect to happen to biomes if projections of climate change prove true? • What happens to biomes when organisms are moved from one continent to another?
Life Histories Biology 356 Ruesink Lecture 3
Life history • The “schedule” of an individual’s life, including • Maturity (age of 1st reproduction) • Parity (number of reproductive bouts) • Fecundity (number of offspring per bout) • Aging (life span, includes survival rates) • On average, all individuals have one successful offspring
One successful offspring (on average) can be achieved by species with high survival and low fecundity or low survival and high fecundity Birds, Figure 10.12
Native and introduced range Ocinebrellus inornatus
Urosalpinx not of management concern 90% spat mortality (1940s oyster bulletins) 55% of net profits lost (Westley 1955) Seed ground abandoned Hand-picking @ $10/bucket Willapa Bay restricted for transfers: seed oyster market lost >40% of mortality in market-sized triploids Oyster drill impacts
Life cycle of oyster drills GROWTH and SURVIVAL REPRODUCTION Direct development in benthic egg capsules
Study sites Resampling
Capsules per female: Conchs per capsule: Minimum reproductive size: Breeding season initiation: 8.4 + 3.8 SD 8.1 + 2.3 SD 30 mm Late-April Oyster drill reproduction
Population dynamics Reproduce twice annually 68 0.3 0.3 ??? 30% yearly survival Reproduce after 2nd year
Life history of elephants (e.g.) • 5 life stages: • Yearling: lasts 1 year, 80% survival • Prereproductive: 98% survival, lasts 15 year • Early reproductive: 98% survival, lasts 5 years, 0.08 offspring/yr • Middle reproductive: 95% survival, lasts 25 years, 0.1 offspring/yr • Post-reproductive: 80% survival
Life history diagram for elephants Middle age fecundity = 0.1/yr Early fecundity = 0.08/yr Post-reproductive 0.8 0.95 0.98 0.98 Yearling 0.8 Early Repro Prereproductive Middle age
Semelparity: reproducing once over the lifespanIteroparity: reproducing multiple times over the life span Salmon are _______________
Semelparity is successful when reproduction is extremely costly, and huge reproductive bouts are beneficial Figure 10.16
Life histories • Diagrams summarize average life history events (usually with 1-year time steps) • Result of natural selection • Represent successful ways of allocating limited resources to carry out various functions of living organisms
Tradeoffs • Size (survival) vs. number of offspring • Fecundity vs. adult survival • Age at first reproduction • Fecundity and growth
Lack clutch • David Lack first suggested that birds limit the number of eggs they lay, because it is costly to raise offspring, and they would be less successful with larger broods. • Test by adding and removing eggs from clutches!
Magpies usually lay 7 eggs. Figure 10.3
Great tits usually lay 9 eggs. But the highest number of surviving young per clutch occurs at 12 eggs. Why? Figure 10.21
Fecundity vs adult survival • Current reproduction may be improved by larger clutch, but future fecundity may suffer
Age at first reproduction • Reproduce now vs. later • Delayed reproduction is common in organisms that become better parents with age (higher fecundity, or larger size)
Total eggs produced by organism that can increase reproductive output by 10 if it waits a year
Fecundity vs growth • Energy may be allocated to reproduction or to growth
Phenotypic plasticity • Change in phenotype due to variation in the environment (not genetics) • Reaction norm describes this change Phen. 1 Phen. 2 Env. 1 Env. 2
Environmental variation in physical conditions • Test for phenotypic plasticity by transplanting individuals (similar genotype) to several environments • Organisms are often better adapted to their local environment than to other places within their range