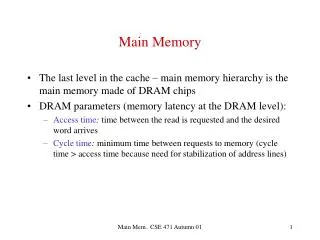
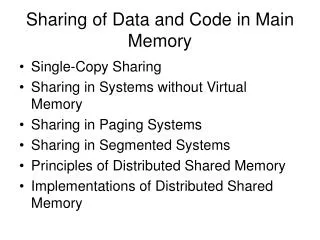
Identifying Hot and Cold Data in Main-Memory Databases
350 likes | 484 Vues
Identifying Hot and Cold Data in Main-Memory Databases. Justin Levandoski Per- Åke Larson. Radu Stoica. Cold Data. Records accessed infrequently in OLTP setting May have become irrelevant to workload Time-correlated and natural skew in real workloads UPS packages

Identifying Hot and Cold Data in Main-Memory Databases
E N D
Presentation Transcript
Identifying Hot and Cold Data in Main-Memory Databases Justin Levandoski Per-Åke Larson RaduStoica
Cold Data • Records accessed infrequently in OLTP setting • May have become irrelevant to workload • Time-correlated and natural skew in real workloads • UPS packages • Some users more active than others
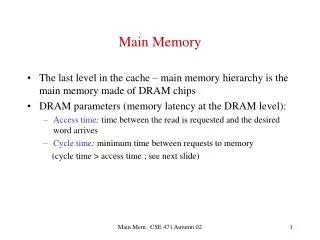
Cold Data (2) • Do we need to keep cold data in memory? • High-density DRAM comes at a large premium • The N-Minute Rule for modern hardware prices
Microsoft SQL Server “Hekaton” • Main-memory optimized database engine targeting OLTP workloads • Designed for high-levels of concurrency • Multi-version optimistic concurrency control • Latch-free data structures • Record-centric data organization • No page-based organization • Oblivious to OS memory pages
Motivation • First step in managing cold data is identifying it • Why not caching? • No page-based organization to exploit • Only record granularity • Space overhead • Cache techniques requires per-item statistics • Overhead on critical path • Cache techniques require book-keeping on critical path • Queue updates introduce 25% overhead in our system • No need to meet a hard deadline • Property we can exploit • Cold data management is a performance/cost optimization
Requirements • Minimize space overhead • Cannot store access statistics on records in the database • 8 Bytes * 50B records = 372 GB • Minimize overhead on critical path • Main-memory systems have short critical paths (speed) • Remove hot/cold classification decision from critical path
Outline • Overview of approach • Siberia • Logging and Sampling • Exponential smoothing • Classification Algorithms • Performance • Conclusion
Siberia: Cold Data Management • Project studying cold data management in Hekaton 1. Cold data classification (this talk) Index Cursor 3. Cold data access and migration Access log Offline analysis Cold record cache Scanner 4. Cold storage access reduction Hot index scanner Cold index scanner Access filters Update memo Memory (hot storage) Siberia (cold storage) 2. Storage techniques Periodic migration
Logging and Sampling <t1> RID2 RID6 RID3 <t2> RID1 RID4 RID2 <t3> RID1 RID5 • Log record accesses • Accesses can be batched and written asynchronously • Write only a sample of record accesses to the log • Sampling minimizes overhead on the critical path • Analyze log to classify hot and cold records • Can be done periodically • Classification can be moved to separate machine if necessary
Exponential Smoothing • Used to estimate access frequencies • W(tk): Score at time tk • Xtk: observed value at time tk • α : decay constant • In our scenario, xtk = 1 if observed, 0 otherwise Example timeline for single record: 1 0 0 0 1 1 tB=t1 t2 tn=tE t3 . . . .
Exponential Smoothing (2) • Chosen due to simplicity and high accuracy • Advantages over well-known caching policies • Works very well with sampling Lower is better Vs. Well-known Caching Techniques
Outline • Overview of approach • Classification Algorithms • Forward approach • Backward approach • Performance • Conclusion
Classification Algorithms • All of our classification algorithms take the same input and produce the same output • Input • Log of sampled record accesses • Parameter K, signifying number of “hot” records • Output • K “hot” record Ids • All approaches use exponential smoothing
Forward Algorithm t1 tn • Forward algorithm • Scan log forward from time t1 to tn • Upon encountering an access for a record, update its estimate in a hash table • Update estimate as: • Once scan is finished, classify top K records with highest access frequency estimate as hot (the rest as cold)
Forward Algorithm in Parallel • Hash partition by record id • Assign a worker thread per partition • Final classification done using estimates from every partition • Partition the log by time • Assign a worker thread to each log segment • Each thread calculates partial estimate for its segment Segment2 Segment1 Segment3 t1 tn tb ta Thread1 Thread2 Thread3
Backward Algorithm t1 • Avoid scanning entire log from beginning to end • Algorithm • Scan log backward from time tn to t1 • Sharpen upper and lower bound for record’s final estimate • Ocassionallyattempt classification using estimate bounds • Discard records that cannot possibly be in hot set tn Time slice tn-4: Time slice tn: Kthlower bound Kthlower bound thrown out below threshold, disregard
Calculating Bounds UpperR(tk) Assume record will be present in every time slice moving back in the log wR(tk) LowerR(tk) Assume record will not be observed again in the log • For record R at time tk, calculate base estimate as: • Upper bound on final estimate value • Lower bound on final estimate value tlast is timeslice of last observed record access, where tlast > tk
Backward Algorithm in Parallel Log • Partition log into N pieces using hash function on record id Hash Function …. Log1 Log2 LogN
Phase I: Initialization K=9 Coordinator Thread • N worker thread and one coordinator thread • Each worker reads back in log segment to find all records in contention for local top K/N • Each worker may read back different lengths Thread1 Thread2 Thread3 Log1 Log2 LogN
Phase I: Initialization (2) Coordinator Thread Thresh: 0.8 Upper: 8 Lower: 3 Thresh: 0.7 Upper: 6 Lower: 3 Thresh: 0.6 Upper: 7 Lower: 3 Thread1 Thread2 Thread3 0.8 0.7 0.6 • Each worker thread reports only three values: • Its local K/Nth threshold value • Upper bound: number of records that are in contention to be in top K/N records • Lower bound: minimum number of records that can be in top K/N records
Phase II: Threshold Search • Final “global” threshold that renders at least K records is between high and low thresholds initialization phase • Controller’s job is to find this final global threshold • Basic idea: • Iterate, choosing new candidate threshold • Polls workers for upper and lower counts for the threshold • Can also ask workers to sharpen bounds for frequency estimates • Details in the paper
Tighten Bounds Operation Coordinator TightenBounds TightenBounds TightenBounds Thread1 Thread2 Thread3 • Tighten Bounds • Each worker reads backward in log and sharpens estimates for its records • Paper describes details of how far back a worker must read
Report Count Operation Coordinator ReportCounts(0.75) ReportCounts(0.75) ReportCounts(0.75) Upper: 2 Lower: 1 Upper: 4 Lower: 3 Upper: 3 Lower: 2 Thread1 Thread2 Thread3 0.75 • Workers calculate upper and lower counts given a threshold valuefrom the coordinator
Phase III: Merge and Report Coordinator {r3, r9, r18} {r4, r8} {r17, r20, r32, r70} Thread1 Thread2 Thread3 r20 r17 r9 r4 r3 r70 r32 r8 r18 0.725 • Workers report the ids of all records with lower bounds above threshold
Outline • Overview of approach • Classification Algorithms • Performance • Setup • Wall Clock Time • Space Overhead • Conclusion
Experiment Setup • Workstation-class machine • HP Z400 with Xeon W3550 @ 3 GHz • 1 Million Records • 1 Billion Accesses • Three access distributions: • Zipf • TPC-E non-uniform random • Uniform random • Eight worker threads used for parallel versions
Wall Clock Time • Classification of 1B Accesses in sub-second times
Space Overhead – Zipf Distribution 6.72 6.72 6.72 6.72 6.72 6.72 6.72
Outline • Overview of approach • Classification Algorithms • Performance • Conclusion
Conclusion • Studied cold data identification in main-memory databases • Cold Data Classification Framework • Microsoft SQL Server Hekaton • No page-based organization • Logging and Sampling Record Accesses • Classification Algorithms • Forward approach • Backward approach • Great Performance • Consistent sub-second classification times for best algorithms • Close to optimal space overhead in practice • Part of Project Siberia • Stay tuned!
Tighten Bounds Details • How far to read back? • During every count, remember minimum overlap value from all records straddling the threshold. Minimum overlap • Bring upper/lower range of all records to value of minimum overlap • Intuition: if bounds are tightened to size of minimum overlap, overall overlap between records should be sufficiently small
Tighten Bounds Details • How far do we read back in the log to tighten bound to given value M? • Recall bounds are calculated as follows: U • Need to read back to a time slice tk such that: < - L • Solving for tk gives us: =
Backward Parallel: Three Phases • Phase I: Initialization • Goal: find an initial set of candidates and gather their statistics for defining a beginning search space • Phase II: Threshold Search • Goal: find a suitable threshold estimate value that will yield at least K records (can be within a tolerable error) • Phase III: Merge and Report • Goal: retrieve hot record ids from each worker thread and merge, creating the hot set.
Forward Algorithm in Parallel (2) • Each segment for an estimate calculated independently • Only last term in each segment relies on score from previous piece Piece1 Piece2 Piece3 t1 tn ta tb • Final aggregation step sums results of each piece