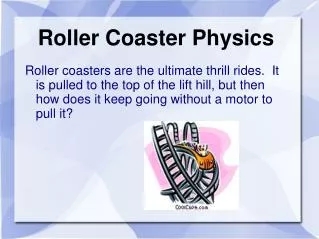
Roller Coaster PBL
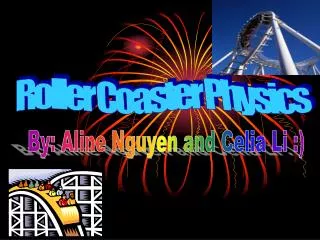
Explore the energy transformations and conservation laws of "The Speed Run" roller coaster through sketches, trials, and calculations. Witness the shift from potential to kinetic energy with thrilling loops and drops. Ride today for an unforgettable experience!

Roller Coaster PBL
E N D
Presentation Transcript
Roller Coaster PBL By: Kayla Dos Santos, Joshua Fitch, and Caelin Goodner
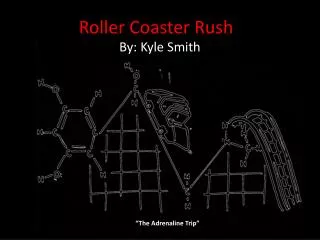
Rough Sketch/Diagram • As you can see, this is an example of our sketch of the roller coaster and where we thought there would be a maximum and minimum of both potential and kinetic energy • Once we got the basic idea of how we wanted The coaster, we went right away and got busy with it
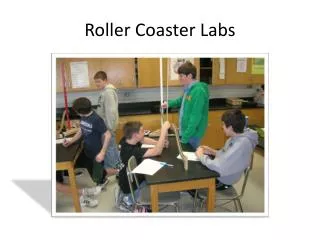
Average Speeds • We tested out roller coaster by doing three trials and here were the results ( we converted meters to centimeters 3.5m to 350cm) • Trial one: 350cm/2.91s= 120.3cm/s (speed) • Trial two: 350cm/3.34s= 104.8cm/s (speed) • Trial three: 350cm/3.49s= 100.3cm/s (speed) Average Speed of all three trials: 108.5cm/s
Energy Transformations • Potential Energy: When at the top of the highest points in the coaster, the drop and the loop, potential energy is gained so it could be transferred into kinetic energy • Mechanical Energy(only at the start): We let go of our ball so it can have at least a little start to be able to go through the whole coaster • Kinetic Energy: As the marble goes down the slopes of both the drop and the loop, the potential energy that was gained is transferred into kinetic energy
Law of Conservation of Energy • First off, the Law of Conservation of energy means that energy is not created nor destroyed so the potential energy used has to be the same amount of kinetic energy or some other type like sound • At the start of the coaster, it begins with potential energy while going down the drop it becomes kinetic energy (one of the max points) • Then comes the loop, while going up potential energy is being gained while going down kinetic energy is being gained • The same goes for the hills
GPE, KE and Acceleration • Mass x gravity x height=GPE: 35,371J • 1/2 x mass x velocity2=KE: 235,445J • V2-v2/time=Acceleration(all averages): 3.3(v2)-0.5(v1)/3.2s= 0.875J
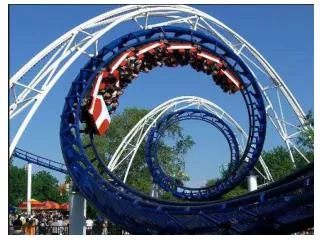
Advertisement • Come and ride "The Speed Run" Today! fun and thrilling ride will leave you wanting to come back! The best part of the whole ride would be the loop because of the anxious feeling you get when going up The coaster and that stomach dropping feeling going down! Try it out!