Download
1 / 38
380 likes | 398 Vues
This case study examines the performance data of a telecom site in Philadelphia over four years. The study focuses on the process of rehydration and catalyst addition to improve the performance of VRLA cells. The results show significant improvements in cell health and financial impact.

E N D
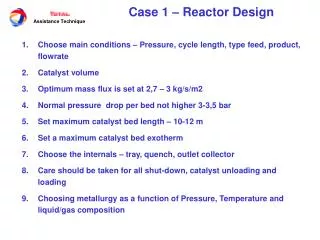
Philadelphia Scientific A Case Study: Four Years of Performance Data at a Canadian Rehydration and Catalyst Addition Site Harold A. Vanasse – Philadelphia Scientific Robert Anderson – Anderson’s Electronics
Presentation Outline • Site Description. • Process Description. • The Science Behind the Process. • Site Results. • Financial Impact. • Trends from 10,000 cells.
Site Description • Central Office site owned by a major telecom. • One string of 24 cells. • “20-Year Design” VRLA Product. • 900 Ah cells. • Major US Manufacturer. • Cells were installed in 1993. • Temperature controlled at 21 – 27 ºC.
Site Description • Good maintenance practices followed. • Dedicated power technicians. • Annual re-torqing of intercell connectors. • Semi-annual conductance testing, voltage measurement and visual inspection. • About as good as it gets for batteries!
Test Site as found in 2000 • Slight bulging of jar cover indicating positive plate growth – not severe at all. • Capacities near 5%! • Customer not happy.
Decision Process Scrap cells and replace with new cells. OR Try adding water & catalysts and save the cells.
Decision Process • Decision: Water and catalysts were added to each cell as a test of the process. • Telecom felt they had nothing to lose.
Philadelphia Scientific Process Steps
Cell Inspection • Cell Leaks: The cell must pass a pressure test in order to qualify. • Physical damage: Positive Plate growth should not be in an advanced stage – no severely bulging jars or covers. • Cell voltage measurement. • Cell temperature measurement.
Process Steps Continued • State of health determined. • Ohmic measurements. • Capacity Test. • Cells Rehydrated -- Water added to each cell. • Catalyst Vent Cap installed into each cell. • Annual follow-up inspections.
What Happens Inside the Cell at Each Step?(This is the technical section!)
What Water Addition Does – Part 1 • Dry out occurs because oxygen and hydrogen gas vent from the cell over time. • As float current rises dry out process accelerates. • The water that was added replaced the water that was lost. • Maintains proper electrolyte.
What Water Addition Does – Part 2 • When glass mat separator dries out it shrinks. • Electrical contact between plates is disrupted (conductance lower). • Water added is absorbed by glass mat. • Glass mat swells like a sponge and restores electrical contact between plates. • Conductance higher/better.
What Catalyst Addition Does • Negative plate self discharge is a fundamental problem with VRLA cells. • Too much oxygen reaches negative plate and causes it to discharge. • This occurs while battery is on float charge! • Polarization of individual plates tells the story.
What is Polarization? • A measure of the voltage on the positive plate and the voltage on the negative plate. • Cell over-voltage is divided between positive and negative plates. • We want to know how the voltage is distributed among the plates.
And Now For Some Math … • An example: Float Voltage 2.27 Volts Open Circuit Voltage 2.15 Volts Overvoltage 0.12 V or 120 mV • The overvoltage is what overcomes the cell’s self-discharge.
Results of a long term lab test serve as example. Non-catalyst cell: All the overvoltage is on the positive. Catalyst cell has a better distribution. Polarization of Plates
The Positive Plate and the Lander Curve Optimum Positive Plate Polarization
Tafel Curve • A diagram that relates polarization and current … among other things. • The next slide shows: • The difference between a healthy and non-healthy distribution of voltage. • How a decrease in positive plate polarization leads to lower cell current.
By placing a catalyst into a VRLA cell: A small amount of O2 is prevented from reaching the negative plate. The negative stays polarized. The positive polarization is reduced. The float current of the cell is lowered. Catalyst Addition
Ongoing Inspections • Site inspected each September from 2001 to 2004. • Parameters: • Visual inspection. • Conductance. • Capacity Test. • Temperature. • Float Voltage.
Site Load-Test Run Time Change(Minutes before 1.90 VPC at 3 Hour Rate)
Site Run Time Change(Minutes at Actual 62 Amp Load -- Calculated)
Anecdotal Evidence • During the August 2003 blackout the battery string at this site did not drop the load. • Site was powered by the battery for 5+ hours until generator arrived and was on-line.
Test Site Data Interpretation • Immediate improvements (within 6 months) result of water addition. • Long term improvements (6 months to 4 years) result of catalyst addition. • The improvements are still being maintained after 4 years. • Site load being protected for the required amount of time (8 hours).
Financial Impact • This string was about to be recycled, however 4 years later it remains in service. • The end user did not need to buy new cells for this site – this purchase has now been deferred for 4 years.
Financial Impact • Based on a financial analysis of actual work at over 375 sites across multiple customers in North America: • For every $1,000 spent on this process $13,000 has been deferred in battery replacement costs. • Typical payback in 4 to 8 months.
Another Way to Look at the Financials • Assume: • Site equipment has 20 year life. • Batteries have 7 year life. • 3 strings of batteries will be purchased throughout the life of the site. • If batteries can last 10 years only 2 strings would be purchased. • Test site is now at 11 years of life. • The requirement to purchase 1 string of batteries has been eliminated.
Trends from 10,000 Cells • Rehydration and catalyst addition process completed on 10,000 cells so far. • Ages range from 1993 to 2001. • Four trends identified: • Cell dry out (or loss of compression) starts earlier then most people believe.
Trends from 10,000 Cells • Trends continued: • New cells are not immune to the problems presented. Negative Plate Self Discharge begins within the first few years. • Ohmic measurements (conductance, resistance, impedance) are good tools to identify problems if data is trended. • By customizing the amount of water added to each cell uniform recovery can be obtained across an entire string.
One Last Bit of Data • 180 cell UPS Site • Internal Resistance data trended over the last 7 years. • Water and Catalysts added in 2002. • Improvements seen in resistance measurements.
Conclusions • VRLA Cells can be recovered from Negative Plate Self Discharge. • Water and Catalyst Addition process can defer replacement of cells that are “failing”. • Our test site is still looking good after 4 years. • Ohmic measurements can provide early warning if data is trended.