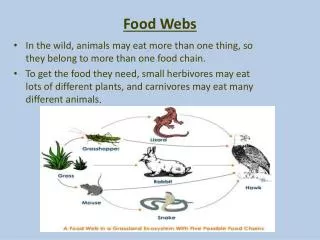
Download
1 / 44
440 likes | 546 Vues
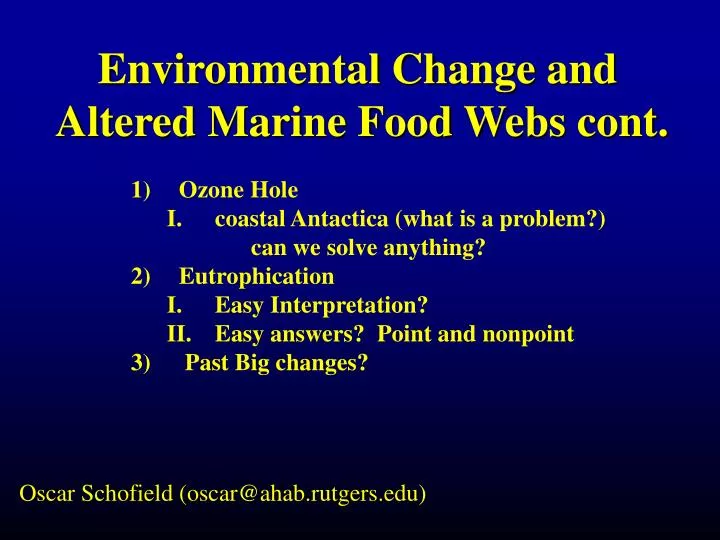
Environmental Change and Altered Marine Food Webs cont. Ozone Hole coastal Antactica (what is a problem?) can we solve anything? Eutrophication I. Easy Interpretation? II. Easy answers? Point and nonpoint Past Big changes?. Oscar Schofield (oscar@ahab.rutgers.edu). OZONE HOLE.

E N D
Environmental Change and Altered Marine Food Webs cont. • Ozone Hole • coastal Antactica (what is a problem?) • can we solve anything? • Eutrophication • I. Easy Interpretation? • II. Easy answers? Point and nonpoint • Past Big changes? Oscar Schofield (oscar@ahab.rutgers.edu)
advection stratification stratification 12 1.6 1.2 8 Production (mg C mg chl a-1 h-1) Growth Rate (day -1) 0.8 4 0.4 0 0 330 350 05 25 45 65 Julian Day
1.6 12000 10000 1.2 8000 Chlorophyll a (mg m -3) 0.8 6000 Growth Rate (day -1) 4000 0.4 2000 0 0 345 365 25 45 65 Julian Day
Large Scales Processes Ozone (DU, ) In the Ozone Hole 300 230 240 250 260 270 280 290 300 310 220 Sept 1 Oct 1 Nov 2 200 100 Sampling a single point in Time: How do you place a process in context? Antarctic Ozone Hole 1993 1992
Transmission Qualities of the Incubator Plastics 0.8 0.6 % Transmission 0.4 1/4" UVT + PE bag 0.2 1/8" UVT + MYLAR + PE bag UF3 + PE bag 0 290 340 390 440 490 540 590 640 690 740 wavelength(nm)
UVB UVA PAR 260 310 360 410 460 510 560 610 660 710 Absorption spectrum for Antarctic Ice Algae 0.012 0.01 0.008 aph ( m2 mg chl a-1) 0.006 0.004 0.002 0 wavelength (nm)
800 600 QPAR = 4 . Ik Light (mmol m-2 s-1) 400 200 [ ] QPAR =Ik 0 6:00 10:00 14:00 18:00 22:00 Local Time
60 O m 5 m >5 m 40 20 % UVB Inhibition of PPAR by UVB 0 -20 0 0.02 0.04 0.06 0.08 (Ein m-2) Smith et al., 1992 Science
Station B at Palmer Station Antarctica 1991-1992 0 0.8 0.7 10 0.6 20 0.5 Depth (m) 0.4 30 0.3 40 0.2 50 0.1 0 60 330 350 015 030 045 060
CO2 QA Fd CH2O Fluorescence QB 2H+ e - PQH2 RC II RC I P680+ 2H+ z Light-Harvesting Pigments O2+ 4H+ 2H2O PAR
bright light flash medium light levels Fm - Fo = Fv darkness Ft some RCII closed, probability of fluorescence is variable FO all RCII open, probability of fluorescence is low Fm all RCII closed, probability of fluorescence is high
0.6 0.4 0.2 0 Impact of UV-radiation on the quantum yield of stable charge separations at photosystem II in Antarctic ice algae fIIeo PAR UVA + PAR UVB + UVA + PAR 14:00 6:00 10:00 18:00 Local Daylight Time
2000 1000 0 Potential Photosystem II activity for Antarctica ice algae on 10/01/1993 PAR PAR + UVA PAR + UVA + UVB Time-integrated charge separations at PS II 12:00 14:00 6:00 8:00 10:00 16:00 18:00 20:00 Local Daylight Time
Qb Ka + Kb UVB radiation Qa 5-10% UVB inhibition Pheo fIIeo e- RCII 23% UVB inhibition sPSII Light- Harvesting Complexes none PAR
Eutrophication Point sources: sewage pipes, you can close the one point. Human Population centers Non point sources: Watershed, atmosphere, etc.
12 m 15 m 20 m 25 m 30 m 35 m 40 m 50 m 100 m 500 m 1000m 2500m Hypoxia/Anoxia & Bottom Bathymetry Warsh – NOAA 1989
Modeled Effect of Bathymetric Variability on Upwelling 1 m/s current velocity Along shore subsurface deltas cause upwelling to be 3d, not 2d. North wind Barnegat delta LEO delta Cape May delta
4 73W 74W 75W 3 Temperature (oC) 2 1 0 93 94 95 96 97 98 99 00 01 Physical Forcing of Hypoxia in Mid-Atlantic Bight Temp (oC) 15 16 17 19 21 22 23 40N Chl a 1.2 mg m-3 0.5 mg m-3 39N Glenn et al. Biogeochemistry of Upwelling in Mid-Atlantic Bight JGR submitted Chang et al. JGR 10.1029/2001JC001018.
Courtesy of Hans Graber, Rich Garvine, Bob Chant, Andreas Munchow, Scott Glenn and Mike Crowley
New Jersey Coastal Upwelling July 6, ’98 - AVHRR July 11, ‘98 - SeaWiFS Chlor-a (mg/m3) Temperature oC 19 20 21 22 24 .1 .3 .5 1 2 4 40N 40N Historical Hypoxia/Anoxia Field Station Field Station LEO LEO 39N 39N 75W 74W 75W 74W Barnegat Cape May
25 A) Area Days 60 20 1 3 5 7 9 12 15 Tidal cycle 1.0 0.8 0.6 0.4 0.2 0 40 Days of Upwelling Total Upwelling Area (100 x km2) 10 20 5 0 0 2500 8 1993 1994 1995 1996 1997 1998 1999 2000 2001 Inshore Offshore Upwelling Absorption at 440 nm (m-1) Depth (m) 2000 6 4 1500 Bottom O2 Variance (mmol kg-1) 3 4 Variance of SST 1000 beam c (m-1) 2 2 500 n=113 r2=0.852 y = 3.19±0.12x + 0.431±0.04 0 12 24 36 48 60 1 Time (hr) 0 0 0 J F M A M J J A S O N D Month 0 0.25 0.5 0.75 1 1.25 POC (mg L-1) Upwelling can account for the historical patterns of hypoxia along the NJ shore
NOy Atmospheric Deposition in 1990 kg N km-2 y-1 Dentener and Crutzen, 1994 Nitrogen Fertilizer Use in 1990 kg N km-2 y-1 Bouwman et al. 1995; FAO statistics Spatially Explicit Global Models Of Nutrient Export To Coastal Systems Sybil Seitzinger John Harrison (Post-doc) GLOBAL NEWS MODEL INPUTS MODEL OUTPUT Average DIN yield by watershed (kg N/km2/yr) Hydrology N, P, Si • dissolved inorganic • dissolved organic • particulate Anthropogenic Activities • OTHER INPUTS: • Slope • Soil C:N • P Fertilizer • Human Population • Animal Manure • Etc. Effects on Coastal Ecosystems Funding Sources: UNESCO-IOC NSF NOAA SEAGRANT
NO3 Export = f(HumanSewage , Fertilizer Use, Atmos. Dep. ) ( Human x 1.85 kg N Population person-1 yr-1 x Fraction urban + NO3 Export = 0.7 x ) [0.4 x Water Runoff 0.8]x [Fert Use + Atmos. Dep.] Model Calculation of NO3 Export by Rivers ( Modified from Caraco and Cote 1999; Seitzinger and Kroeze 1998)
STN Model Predicted Runoff (mm/yr) N Fertilizer Use (kg N/km^2/yr) Model Input Total N Fertilizer (kg/N/km^2/yr) Mean Runoff (mm/yr) 0 0 1 - 530 1 - 63 531 - 931 64 - 145 932 - 2151 146 - 185 2152 - 2672 Data Sources: Vorosmarty et al 2003 RIVM Dentener, pers. comm. 186 - 247 2673 - 3133 248 - 304 3134 - 4664 305 - 420 4665 - 5138 421 - 541 5139 - 5795 542 - 699 5796 - 40023 700 - 2095 Population Density Atmospheric Deposition (NOy) (kg N/km^2/Yr) (individual/km^2) NOy (kg N/km^2/Yr) 56 - 135 Pop Density (indiv/km^2/ws) 136 - 198 0 - 3 4 - 18 199 - 252 19 - 29 253 - 304 30 - 42 305 - 342 43 -59 343 - 382 60 - 83 383 - 439 84 - 103 440 - 512 104 - 138 139 - 237 513 - 651 238 - 965 652 - 902
Modeled vs Measured DIN Export by Mediterranean Rivers Rhone Po Ebro Axios Var Adige Arno Segura Pinios Data: European Envir. Agency
DIN Export from Watersheds (kg N *10E6/basin/yr)
DIN Export vs Coastal Chl a for 6 Sub-regions of the Mediterranean
Delwiche, C.F. (1999) Tracing the thread of plastid diversity through the tapestry of life. Am. Nat. 154: 5164-77.
Phytoplankton in the geological record Green lineage Red lineage Prymnesiophytes Species diversity/abundance (relative scale) Dinoflagellates Prasinophytes & Chlorophytes ? Diatoms Carbon. Permian Triassic Jurassic Cretaceous Tertiary PALEOZOIC MESOZOIC CENOZOIC
Elemental composition of phytoplankton Macronutrients • In 1934, Alfred Redfield recognized that there is a remarkable similarity between the N:P ratio in the organic matter of plankton and the corresponding ratio of NO3- and PO43- in seawater: C106 N16 P 1. • N:P ratio > or < than 16 is used as an indicator • of nitrogen or phosphate limitation.
Fe 10 0 Mn 10 0 Cu 0.5 Trace metal quotas (mmol/ mol P) 0.0 Zn 2.0 0.0 Cd 1.0 0.0 Co 0.5 0.0 B. brevirostris D. tertiolecta T. weissflogii N. atomus E. huxleyi P. provasolli G. oceanica
Sea level and the size of diatoms R = 0.74
A potential climatic feedback: The evolution of large diatoms in a Hothouse world Increase the efficiency of the biological pump Decreased drawdown of CO2, warming Drawdown of CO2 and climatic cooling, and decreased shelf area Small cells decrease efficiency of biological pump Radiation of small diatoms in response to reduced shelf areaandlow CO2
(from N.Gruber) Monthly mean sea level at San Francisco (1855-1990) Annual averages of sea level at Venice and Trieste (1875-1980)