Download
1 / 47
480 likes | 572 Vues
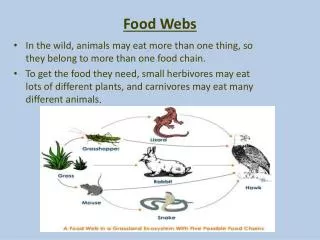
Explore the intricacies of the marine food webs, focusing on factors like light, nutrients, and food web structure, featuring examples of what controls these webs. Discover the significance of nutrient types, sizes, and exports within the ecosystem.

E N D
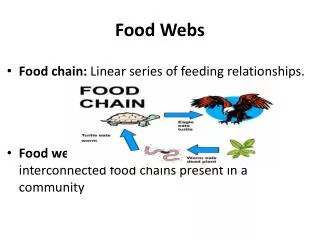
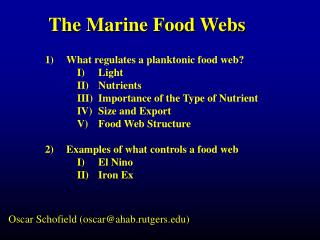
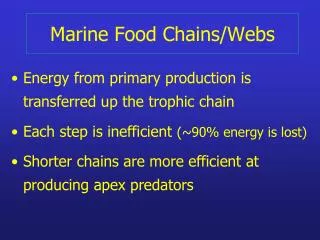
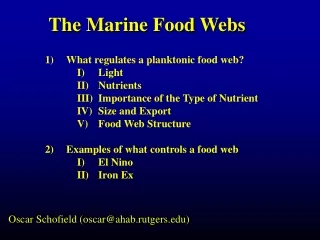
The Marine Food Webs • What regulates a planktonic food web? • Light • Nutrients • Importance of the Type of Nutrient • Size and Export • Food Web Structure • Examples of what controls a food web • El Nino • Iron Ex Oscar Schofield (oscar@ahab.rutgers.edu)
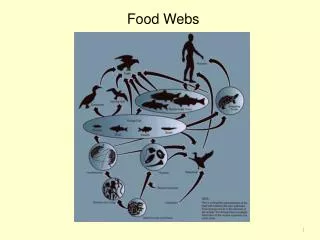
carnivores omnivores autotrophs
Gephyrocapsa oceanica Pyramimonas parkeae Dunaliella tertiolecta Thoracosphaera heimii Diatom sp. Ditylum brightwellii Ceratium sp.
I) Light Irradiance Intensity z1 Ed1 Z (meters) Dz • Because of • Lambert Beers Law • the ocean is dim z2 Ed2 • Plant life is • dependent on light Lambert Beers Law Ed2 = Ed1e-Dz*Kd 3) The 1% light level for the majority of the is 100 m or less?
2000 μmol photons (m-2 s-1) 1500 1000 500 Calendar Day 0 Depth (m) Calendar Day μmol photons m-2 s-1 Oliver et al. JGR 2004
m 10 Pmax a 8 6 Productivity (mg C mg Chl a-2 h-1) 4 Ik = Pmax/a 2 Respiration 0 0.1 1 10 100 1000 Irradiance (mmol photons m-2 s-1)
Irradiance Intensity Irradiance Intensity Temperature Temperature Z (meters) PP Ed time
net photosynthesis net primary production phytoplankton respiration community respiration Z (meters) euphotic zone Critical depth NPP = Rc Note these are integrated over the water column.
>3 CHL a mg m-3 UML 0 High wind Low wind
Nutrients Irradiance Physical mixing processes Phytoplankton
Biomass and Nutrients Sta E (1993-1994)
Austin Powers Fat Bastard Model System, eats fast when a lot available, but sloppy & alot ends on his shirt not in his belly NO3 NO3 NO3 NO3 NO3 NO3 Vmax Nutrient Uptake Miss Manner Model System, eats slow and efficiently, everything ends up in her belly Ks Nutrient concentration (can be nitrogen, phosphorus)
Different Strategies of Nutrient Utilization • Coccolithophores • Low Vm • Low Ks • Diatoms • High Vm • High Ks High or fluctuating nutrients High mixing, upwelling Low average irradiance, light fluctuations High turbulence Chronically oligotrophic Stratified conditions High average irradiance Low turbulence
Nutrients are low Nutrients are high Size n = 6695 Remember small cells, higher surface to volume ratio
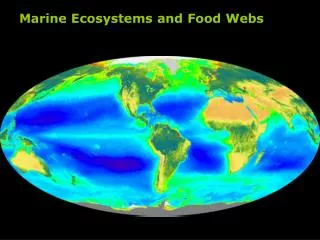
Various phytoplankton concentrations of earth's oceans. • Purple and blue areas - unproductive regions (open ocean areas) • Red and orange areas - productive regions (coastal areas, small basin)
180oW 135oW 90oW 45oW 0 45oE 90oE 135oE 180oE 90oN 60oN 30oN 0o 30oS 60oS 90oS More recently satellite algorithms have been developed for some phytoplankton taxa detection Iglesias-Rodriguez et al. 2000
Surface chlorophyll from CZCS Vertical distribution of Chl from 21,000 profiles Mixed layer depth from NOAA-NODC archive Surface nutrients Brunt-Vaisala 57 provinces on the basis of: Longhurst 1995
Physical mixing processes Phytoplankton Nutrients Zooplankton Higher Trophic Levels Irradiance
GRAZERS in the plankton sea hard-bodies, sexual, consume specific particle size ranges, roving bands soft-bodies, asexual, consumes all particle sizes, bloom & bust
10 fish This assumes a trophic transfer efficiency of 10% 0.1 100 zooplankton 0.1 1000 phytoplankton
Upwelling zones (2 trophic levels) Phytoplankton Anchovies (20 % transfer efficiency) Coastal Regions (4 trophic levels) Phytoplankton herbivorous zooplank.carnivorous zooplank.fish (15% efficiency) Open ocean (5 trophic levels) Phytoplanktonherb. Zooplank.carniv. Zooplank.carniv. Fishtuna (10% efficiency)
(metric tons per year) (metric tons carbon per year) Area Plant prod. Efficiency Trophic levels Est. fish Open 39*109 10% 5 4*106 Ocean Coastal 8.6*109 15% 4 29*106 Ocean upwelling 0.23*109 20% 2 46*106
Physical mixing processes Phytoplankton Nutrients Zooplankton Sinkage & Senescence Higher Trophic Levels Particle Dynamics Particle Flux (Carbon flux) Irradiance
Sequestration of Atmospheric Carbon Chisholm, 2000
MARINE SNOW What is it? How is formed? (particle-particle, sticky, virus) Why is it important?
While photosynthesizing DOM is exuded These molecules encounter one another in the aqueous environment Snow Formation Diatom Through cation binding the molecules come together forming larger particles Hey look! Here comes a Diatom! The particles are extremely “sticky” and easily adhere to each other as well as other particles in the water
Marine snow particles from off New Jersey
Mixed Layer Depth Water column depth Wind CO2 Fe S N2 Irradiance Mixing processes Regenerated Nutrients Phytoplankton rivers New Nutrients Zooplankton Mixed Layer Depth Sinkage & Senescence Higher Trophic Levels Continental shelf Particle Dynamics Continental slope Elemental Flux Carbon Fe N2
A Natural Experiment: Are nutrients from the deep ocean driving the primary productivity? El Nino
Top: “normal” forcing conditionBottom: El Niño forcing condition Normal El Nino Open University, 1998
Top: normal Bottom: El Niño condition Normal El Nino Open University, 1998
El Nino Note coastal effect La Nina JPL
So lets do an experiment: What limits productivity in a high nitrogen/phosphorus ocean? Is it iron limited? Go to a HNLC Ocean (Antarctic), going means sending a graduate student, dump iron in the ocean and watch the phytoplankton respond.
Iron Patch Health Red = Healthy Blue = Not happy
Cell size effects the trophic transfer of matter and energy in the food web • Cullen et al. (Cullen et al., 2002)
(from N.Gruber) Net CO2 flux (Takahashi et al 1995) Example: variability in carbon uptake