Download
1 / 1
20 likes | 256 Vues
Comparison of emissions and vegetation calculated for different climates Pre-Industrial Eocene 4xPI CO 2. Isoprene Emissions / Tg yr -1. Monoterpene Emissions / Tg yr -1. Deciduous Needle leaf. Deciduous Broad leaf. Evergreen Needle leaf.

E N D
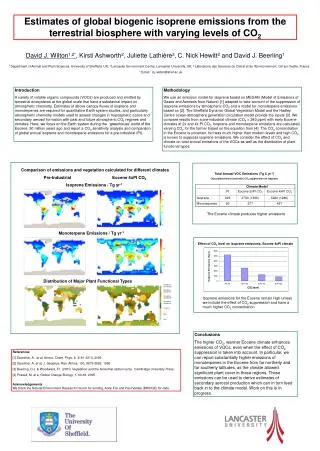
Comparison of emissions and vegetation calculated for different climates Pre-Industrial Eocene 4xPI CO2 Isoprene Emissions / Tg yr-1 Monoterpene Emissions / Tg yr-1 Deciduous Needle leaf Deciduous Broad leaf Evergreen Needle leaf Evergreen Broad leaf C3 grass Bare Sea Distribution of Major Plant Functional Types Isoprene emissions for the Eocene remain high unless we include the effect of CO2 suppression and have a much higher CO2 concentration. Effect of CO2 level on isoprene emissions, Eocene 4xPI climate Estimates of global biogenic isoprene emissions from the terrestrial biosphere with varying levels of CO2 David J. Wilton1,2*, Kirsti Ashworth2, Juliette Lathière3,C. Nick Hewitt2 and David J. Beerling1 1 Department of Animal and Plant Sciences, University of Sheffield, UK; 2 Lancaster Environment Centre, Lancaster University, UK; 3 Laboratoire des Sciences du Climat et de l'Environnement, Gif-sur-Yvette, France * Email : d.j.wilton@shef.ac.uk Introduction A variety of volatile organic compounds (VOCs) are produced and emitted by terrestrial ecosystems at the global scale that have a substantial impact on atmospheric chemistry. Estimates of above canopy fluxes of isoprene and monoterpenes are required for quantitative Earth system studies, and particularly atmospheric chemistry models used to assess changes in tropospheric ozone and secondary aerosol formation with past and future atmospheric CO2 regimes and climates. Here, we focus on the Earth system during the ‘greenhouse’ world of the Eocene, 50 million years ago and report a CO2 sensitivity analysis and comparison of global annual isoprene and monoterpene emissions for a pre-industrial (PI). Methodology We use an emission model for isoprene based on MEGAN (Model of Emissions of Gases and Aerosols from Nature) [1] adapted to take account of the suppression of isoprene emissions by atmospheric CO2 and a model for monoterpene emissions based on [2]. The Sheffield Dynamic Global Vegetation Model and the Hadley Centre ocean-atmosphere generation circulation model provide the inputs [3]. We compare results from a pre-industrial climate (CO2 = 280 ppm) with early Eocene climates at 2x and 4x PI CO2. Isoprene and monoterpene emissions are calculated, varying CO2 for the former based on the equation from [4]. The CO2 concentration in the Eocene is uncertain, but was much higher than modern levels and high CO2 is known to suppress isoprene emissions. We consider the effect of CO2 and climate on total annual emissions of the VOCs as well as the distribution of plant functional types. Total Annual VOC Emissions (Tg C yr-1) Calculated without (and with) CO2 suppression on isoprene The Eocene climate produces higher emissions Conclusions The higher CO2, warmer Eocene climate enhances emissions of VOCs, even when the effect of CO2 suppression is taken into account. In particular, we can report substantially higher emissions of monoterpenes in the Eocene from far northerly and far southerly latitudes, as the climate allowed significant plant cover in these regions. These emissions can be used to derive estimates of secondary aerosol production which can in turn feed back in to the climate model. Work on this is in progress. References [1] Guenther, A. et al, Atmos. Chem. Phys, 6, 3181-3210, 2006 [2] Guenther, A. et al, J. Geophys. Res. Atmos, 100, 8873-8892, 1995 [3] Beerling, D.J. & Woodward, F.I. (2001) Vegetation and the terrestrial carbon cycle. Cambridge University Press. [4] Possell, M. et a, Global Change Biology, 1, 60-69, 2005 Acknowledgements We thank the Natural Environment Research Council for funding, Andy Fox and Paul Valdes (BRIDGE) for data.