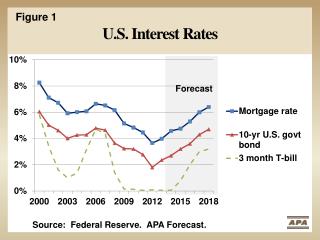
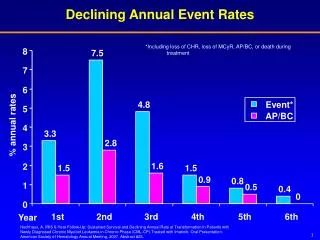
Declining U.S. Internal Migration Rates
Declining U.S. Internal Migration Rates. Note: Different state 2004-05 7,441 major declines in each type 2005-06 5,679 2006-07 4,862

Declining U.S. Internal Migration Rates
E N D
Presentation Transcript
Note: Different state 2004-05 7,441 major declines in each type 2005-06 5,679 2006-07 4,862 Different county, 2005-06 8,010 same state 2006-07 7,436 2007-08 6,282 Different county 2004-05 15,287 2005-06 13,690 2006-07 12,298 2008-09 11,009 Different residence 2004-05 22,736 but residential mobility 2005-06 24,851 increases 2006-07 25,192
Some Possible Reasons for the Recent Decline in U.S. Internal Migration Rates The business cycle The current recession began at the end of 2007, but migration rates began to fall one or two years earlier. Moreover, even though the current recession has been much more serious than previous recessions, the drop in migration is somewhat smaller, according to MSW. Dismiss as a cause, according to MSW. The claim that the drop in migration is somewhat smaller during the current recession is open to question. check 1990-92 2000-02 1988-92 1978-83
MSW extrapolate trends in migration, 1996-2006 and 1986-2006. Based on the 10-year extrapolation, migration rates would have fallen 0.23 percentage points between 2007 and 2009. Based on the 20-year extrapolation, they would have fallen by 0.25 percentage points. They actually fell by 0.36 percentage points, so MSW claim that very little of the drop remains to be explained by the recession. This type of comparison I like. Still dismiss as a cause.
2. The housing-market contraction This contraction occurred at about the same time as the drop in migration. What are the possible mechanisms? When housing prices drop, homeowners may find themselves upside down in their mortgages (owe more than the current value of their property). They become less likely to move. We have no specific evidence to support this hypothesis, so the rationale is very speculative. Falling house prices cause pessimism concerning future house prices, so renters do not buy homes and owners do not move up in terms of housing quality. Migration falls. Again,very speculative with no supporting empirical evidence.
Both hypotheses suggest that homeowner migration rates should have fallen more than those of renters. In percentage point terms, neither interstate nor intercounty rates fell more for homeowners. The percentage decline was larger for homeowners, but homeowners generally have lower migration rates than renters. Dismiss as a cause.
Retirement migration is down Check the data for 2009-10 relative to 1999-2000. The big decline had not yet begun in 1999-2000.
All age classes are down. Retirement migration is down, and it is down slightly more than other age classes. However, in itself, retirement migration is not of sufficient magnitude to cause the overall rate to fall so substantially. Dismiss as a basic cause, but could be a slight contributing cause.
Migration to the West is down substantially. 5. Migration to or from other regions is down substantially. Let’s look at the in- and out-migration experiences of the various regions before and after the decline in migration rates.
In-migration (thousands) to Northeast Midwest South West 1999-2000 363 722 1,258 764 2009-2010 246 414 897 631 (-32.2%) (-42.7%) (-28.7%) (-17.4%) Out-migration (thousands) from 1999-2000 615 640 1,031 819 2009-2010 376 637 698 477 (-38.9%) (-0.5%) (-32.3%) (-41.8%)
4. In-migration to the West is down less than in-migration to the other regions. Dismiss as a cause. 5. However, out-migration from the West has fallen more than out-migration from any other region. Why might this have happened? Out-migration from the Midwest has hardly changed. What is happening in the Midwest to make its out-migration experience so different than the other regions?
Counterfactual based on 1980-1985 propensities; actual is 2000-2005 FromToCounterfactualActual Northeast Midwest 415 288 -30.6% South 1,524 1,512 - 0.8 West 518 514 - 0.8 Midwest Northeast 365 228 -37.5 South 2,177 1,382 -36.5 West 1,274 719 -43.6 South Northeast 873 710 -18.7 Midwest 1,145 930 -18.8 West 1,375 1,062 -22.8 West Northeast 353 352 - 0.3 Midwest 991 691 -30.3 South 1,6071,230 -23.5 12,617 9,618 0.0473 0.0361 Something appears to be going on in the Midwest. Have the most mobile already departed? Has migration from rural areas diminished because the young and most mobile have already moved?
6. The system has moved closer to being an equilibrium system. If this is the case, then presumably people have sorted themselves in such a way that migration is being driven by shocks to the system and by long-term trends that change the spatial pattern of economic opportunities and demands for location-specific amenities. Discuss the neoclassical model: movement of people and capital. This could be a cause, but I am skeptical because the migration-rate changes occurred over a very short span of time. Interregional migration has been occurring since the founding of the nation, and if this factor were driving the changes, we would, I think, expect the movement toward long-term equilibrium to have occurred gradually over a long period of time.
Demographic change It is possible that changes in the age structure of the U.S. population have contributed to declining internal migration rates. If this were to have occurred, it most likely would have been due to population maturing out of the ages for which migration rates are highest (18-39). To test this hypothesis, I did a counterfactual. I distributed the 2009 population as it was age distributed in 1999. Then I applied 2009-10 migration rates to the hypothetical 2009 population. The result was almost no change in the national migration rate. Dismiss as a cause. However, over longer periods of time, demographics do matter. They also can matter over shorter periods of time, such as during the 1970s and 1980s when the baby boom was maturing into the most highly mobile age classes and later out of these age classes. The baby boom has now aged into relatively low migration-rate ages, and thus over short periods of time is unlikely to have much effect on national rates.
8. Method of measuring migration. MSW discuss several migration data sources. In their work, they aggregate from microdata in order to avoid various measurement issues. This is a good practice. But does it avoid the so-called “hot deck” imputation procedures that some think have biased the migration rates down so severely in recent years? Open question. Bottom line: ????