Research Design
360 likes | 499 Vues
Research Design. 10/16/2012. Readings. Chapter 3 Proposing Explanations, Framing Hypotheses, and Making Comparisons ( pp. 58-76) Chapter 5 Making Controlled Comparisons C hapter 4 Making Comparisons (Pollock Workbook ). Homework. Short homework assignment on the paper due today.

Research Design
E N D
Presentation Transcript
Research Design 10/16/2012
Readings • Chapter 3 Proposing Explanations, Framing Hypotheses, and Making Comparisons (pp. 58-76) • Chapter 5 Making Controlled Comparisons • Chapter 4 Making Comparisons (Pollock Workbook)
Homework • Short homework assignment on the paper due today Time Series Data
Office Hours For the Week • When • Wednesday 11-1 • Thursday 11-12 • Friday 10-11 • And appointment
Course Learning Objectives • Students will learn the research methods commonly used in behavioral sciences and will be able to interpret and explain empirical data. • Students will learn the basics of research design and be able to critically analyze the advantages and disadvantages of different types of design.
Types of Observational Studies • Cross-Sectional • Time-Series • Panel Studies
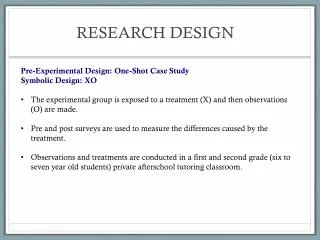
Case Study Design • What is it? • N=1 (one unit in your study) • Problems
Bivariate Data Analysis CROSS-TABULATIONS
Variables • Dependent Variable- the variable/result that you want to explain. • Independent Variable(s)- the variables that you believe will cause/explain/change your dependent variable
What are Cross Tabs? • a simple and effective way to measure relationships between two variables. • also called contingency tables- because it helps us look at whether the value of one variable is "contingent" upon that of another
When to use them • When you have 2 variables • They can only be used for categorical variables • ordinal (variables are ranked, but the differences between them are not certain (Less than HS, Hs, College, Grad School), • nominal variables (the variables are simply given names Gingrich, Perry, Romney, Santorum)
You can use them if you have • two ordinal variables • one nominal and one ordinal variable • two nominal variables. • Your variable can take less than 10 categories
When it is a bad method • If you have ratio or interval variables • You have a variable with more than 10 values • You want to test multiple independent variables against a single d.v.
Open Up the GSS • Open GSS2008
What is it • Dependent variable- Happiness • Independent variable- Intelligence • What would be the hypothesis
Running Cross Tabs • Select, Analyze • Descriptive Statistics • Cross Tabulations
Running Cross-Tabs We have to use the measures available • Dependent variable is usually the row • Independent variable is usually the column.
Case Processing Summary • Ignore the case Processing Summary • Delete it from your outputs
Cross-Tab Terminology • Rows (appear along the side of the table) and Columns (appear at the top) • the categories formed by the intersection of a column is called a cell
The Outputs • As “Education increases, unhappiness increases” • Raw Counts are not very helpful Most are “pretty happy”
Lets Add Some Percent's Click on Cells Cell Display
Row %'s- This measures data across the row • 15% of people who are very happy have >11 years of education • Overall 27.7% have 16+ and 17.5% are less than 12. • This allows us to measure change across one category and compare to the total
Column %'s This measures data down each column • Compare across each column • 37.0% of 16+ are very happy vs 27.0% of >11’s • 6.5 of 16+ are not too happy, vs 23.3% of people with low education • Overall, 31.6% of people are very happy
How we interpret • Using Face Validity to interpret x-tabs • is there a pattern? • does one column stand out? • When we have two ordinal variables we can state directional relationships!
When do we use this? • A way to compare ratio variables by controlling for an ordinal or nominal variable • One ordinal vs. a ratio or interval • One nominal vs. a ratio or interval • This shows the average of each category
In SPSS • Open the States.SAV • Analyze • Compare Means • Means
Where the Stuff Goes • Your categorical variable goes in the independent List • Your continuous variable goes in the Dependent List
Reading the Output • We can compare each region against each other and the total • For ordinal variables, we can state relationships • This is all face validity!
The Practical Significance • Why do some regions smoke more? (possible i.v.’s) • What are the policy effects? • Is smoking harmless?