Download
1 / 12
120 likes | 249 Vues
Total Population Growth in Utah 1990-2000. Utah is the fourth fastest growing state in the U.S. in total population 1- Nevada 2- Arizona 3- Colorado 4- UTAH 5- Idaho. 65 and Older Population Growth in Utah 1990-2000.

E N D
Total Population Growth in Utah 1990-2000 • Utah is the fourth fastest growing state in the U.S. in total population • 1- Nevada • 2- Arizona • 3- Colorado • 4- UTAH • 5- Idaho
65 and Older Population Growth in Utah 1990-2000 • Utah is the sixth fastest growing state in the U.S. in the 65+ population • 1- Nevada • 2- Alaska • 3- Arizona • 4- New Mexico • 5- Hawaii • 6- UTAH • 7- Colorado
Life Expectancy in the U.S. • Utah is third in life expectancy • 1- Hawaii • 2- Minnesota • 3- UTAH • 4- North Dakota • 5- Iowa
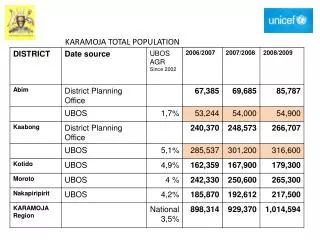
Percent of County who are 65+ and older • Piute 17.1 Millard 12.3 • Washington 17.0 Sanpete 10.8 • Kane 16.7 Box Elder 10.4 • Wayne 14.4 Weber 10.3 • Rich 14.1 Emery 10.1 • Garfield 14.1 Uintah 9.9 • Beaver 13.9 Juab 9.8 • Daggett 13.5 Duchesne 9.4 • Carbon 13.3 Morgan 8.7 • Sevier 12.9 Iron 8.6 • Grand 12.5 STATE TOTAL8.5%
Figure Utah’s Changing Age Structure Source: 2002 Baseline Projections, GOPB; UPED Model System
Figure Projected School Age Population Source: 2002 Baseline Projections, GOPB; UPED Model System
Figure Growth of 65 and Older Age Group Source: 2002 Baseline Projections, GOPB; UPED Model System
Figure U.S. Dependency Ratios: 1990 to 2030 78 67 62 63 61 Source: 2002 Baseline Projections, GOPB; UPED Model System
Figure Utah Dependency Ratios: 1990 to 2030 82 74 69 72 67 Source: 2002 Baseline Projections, GOPB; UPED Model System