Download
1 / 91
910 likes | 1.12k Vues
Overview of HIV Disease. Dr. Marianne Harris AIDS Research Program St. Paul’s Hospital. Adults and Children Estimated to Be Living With HIV, 2008. Eastern Europe and Central Asia 1.5 million. Western/ Central Europe 730,000. North America 1.2 million. East Asia 740,000.

E N D
Overview of HIV Disease Dr. Marianne Harris AIDS Research Program St. Paul’s Hospital
Adults and Children Estimated to Be Living With HIV, 2008 Eastern Europe and Central Asia 1.5 million Western/ Central Europe 730,000 North America 1.2 million East Asia 740,000 North Africa and Middle East 380,000 Caribbean 230,000 Southern and Southeast Asia 4.2 million Sub-Saharan Africa 22 million Latin America 1.7 million Oceania 74,000 Total: 33 (31-36) million UNAIDS, 2008. Available at: http://www.unaids.org.
Life Expectancy Five African Countries: 1970 - 2010 Canada life expectancy (2006 estimate): 80.22 years 6
Development of AIDS is like an impending train wreck where: Viral Load = Speed of the train CD4 count = Distance from site of doom HIV infection J. Coffin, XI International AIDS Conf., Vancouver, 1996
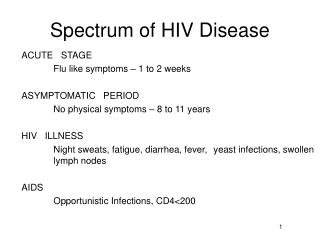
HIV Natural History • 8 to 10 years of symptom-free living after initial infection with the virus • As CD4 count drops, the potential for opportunistic infections (OIs) increases • AIDS is defined by certain OIs and cancers
Oropharyngeal Candidiasis • White patches in mouth (thrush) • Pain/burning with eating • Can spread to esophagus painful swallowing, burning in chest • Cause of weight loss, wasting
Pneumocystis carinii pneumonia (PCP) • New name: Pneumocystis jiroveci • Symptoms include dry cough, shortness of breath and fever • Possibly anorexia and/or fatigue • Insidious as compared to bacterial pneumonia • CXR nonspecific • Diagnosed with bronchoscopy/biopsy
Toxoplasmosis • Seizures, motor disturbances or altered mental status • Space-occupying lesion in the brain • Diagnosed with serum serology and a CT or MRI scan • Differential diagnosis: CNS lymphoma
Kaposi’s Sarcoma • Pink, red or violet lesions which generally begin on the skin or the mouth • Can be in GI or respiratory tract • As lesions enlarge, they darken and coalesce to form raised plaques or tumours • Diagnosed with a biopsy of lesions • Any CD4, AIDS-defining • Caused by Human Herpes Virus 8 (HHV-8) • Treated with radiation/chemotherapy (ARVs)
Targets for HIV Inhibition Protease Inhibitors EntryInhibitors Maturation Inhibitors Reverse Transcriptase Inhibitors Integrase Inhibitors
ARV-induced pVL changes are associated with a change in the rate of CD4 decline CD4 Low pVL Hi pVL Time, years
Goals of therapy • Maximal and durable suppression of viral load to <50 copies/mL • Restore/preserve immune function • Improve quality of life • Reduce HIV-related morbidity/mortality
What are the risks? • Poor compliance resistance limitations on future treatment options • Short- and long-term side effects
HIV Drug Resistance • Reduced susceptibility of virus to one or more ARV drugs • Patient has many strains of virus; may harbour sensitive and resistant strains at the same time • Testing picks up the predominant viral populations • Minority populations don’t go away
Why does it happen ? Lots of viruses are made every day; there is a natural variation of drug sensitivity
Why does it happen ? Lots of viruses are made every day; there is a natural variation of drug sensitivity
Why does it happen ? If replication is not completely stopped, those which are less susceptible can eventually escape Resistant Virus
Implications of Resistance • Resistance can develop to any/all drugs • Resistance to 1 drug in a class often means resistance to others (cross resistance) • Sometimes the resistant virus is passed from person to person: “Primary resistance” (5-10% ) • Resistance will not go away when drug is removed (even if main virus reverts to “wild type”) - resistant viruses are archived • Develops when virus is allowed to reproduce when antivirals are around (i.e. suboptimal levels of drug which do not suppress virus completely)
100.0 80.0 60.0 Percentage of Patients with pVL <50 copies 40.0 20.0 0.0 1999 2001 2003 2005 2009 2007 Year BC Data: Viral load <50 copies/mL over time (N approx. 7400 in DTP) ?100% (2010) 86% (2007) 65% (2000) V Lima, et al., CROI 2008;Poster #895
600 500 3TC nRTI 400 PI Any 300 200 100 0 2008 2000 1996 1998 2002 2004 2006 Year Rates of New Resistance in BC Number of New Cases of Resistance detected V Lima, et al., CROI 2008;Poster #895
100% 84% 75% Mantel-Haenszel 64% trend test p = 0.001 50% 47% 24% 25% 12% 0% <70% 70% - <80% 80% - <90% 90% - <95% 95% - 100% Viral Load Stratified by Adherence level (first 12 months of therapy) Mantel-Haenszel Trend test p = 0.001 Percent of Participants With pVL<500 Copies At Least Twice Adherence Level Low-Beer et al. JAIDS 2000.
What are the risks? • Poor compliance resistance limitations on future treatment options • Short- and long-term side effects
Incidence of MI by ART duration Relative rate per additional year of exposure to ART*: 1.17 (95% CI: 1.08-1.26), p<0.0001 Incidence / 1000 PY/ 95% CI HAART Exposure (yrs) None <1 1-2 2-3 3-4 4-5 5-6 >6 No. of MIs 14 16 22 34 56 55 39 41 277 Patient years 10,103 6,324 8,165 10,846 13,060 12,254 9,073 6,751 76,577 HAART=combination antiretroviral therapy*Adjusted for conventional risk factors not influenced by HAART El-Sadr et al, CROI 2005: Oral session #10
HIV+ with CD4 count > 350/mm3 84% on ART, 16% off ART Randomized n = 2752 n = 2720 • Intermittent ART • Stop or defer when CD4 > 350 • Restart/start if CD4 < 250 Continuous ART Follow-up 33% on ART 96% CD4 > 200 94% on ART 99% CD4 > 200 N Engl J Med 2006
Time Time Continuous vs Intermittent HAART
Endpoints of the SMART study, including cardiovascular disease N Engl J Med 2006
Number of events Intermittent Continuous ART ART 113 73 All serious non-AIDS Non-AIDS malignancy 27 24 Renal 9 2 CVD 48 31 Liver 10 7 Other non-AIDS death 30 16 0.5 1 2 3 5 10 Hazard ratio Intermittent ART vs. Continuous ART SMART: Risk of serious non-AIDS events Of the 85 deaths that occurred in SMART, only 7 (8%) were from AIDS diseases SMART, NEJM 2006 & Neaton et al, Current Opinion in HIV/AIDS 2008
Summaryof SMART Study • HIV is a chronic inflammatory disease • Inflammation: important driver of non-AIDS events • heart, liver, kidney, etc • malignancies • Inflammation: important driver of CD4 decline • ADIs at a late stage of the disease
B.C. CENTRE FOR EXCELLENCE IN HIV/AIDS http://www.cfenet.ubc.ca
HIV Prevention Dr. Marianne Harris AIDS Research Program St. Paul’s Hospital
Estimated New HIV Infections: Canada 1981 - 2005 Source: CCDR. August 2006. 49
50 Source: STI/HIV Prevention and Control, BCCDC. 2006 Annual Report.