Assimilation of QuikSCAT/SeaWinds Data at JMA: A Study on Wind Impact
760 likes | 778 Vues
Learn how JMA assimilates QuikSCAT/SeaWinds data into its Global Data Assimilation System, impacting typhoon forecasts with 3D-VAR analysis experiments.

Assimilation of QuikSCAT/SeaWinds Data at JMA: A Study on Wind Impact
E N D
Presentation Transcript
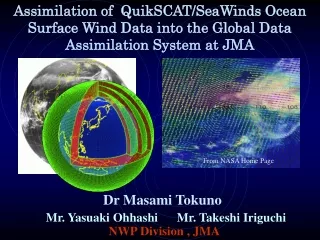
Assimilation of QuikSCAT/SeaWinds Ocean Surface Wind Data into the Global Data Assimilation System at JMA From NASA Home Page Dr Masami Tokuno Mr. Yasuaki Ohhashi Mr. Takeshi Iriguchi NWP Division , JMA
CONTENTS • Introduction • 2. Assimilation system for scatterometer • 3. Impact study for QuikSCAT wind data • 3.1 Configuration of the experiment • 3.2 Quality of SeaWinds data • 3.3 An example of OSE (1 Dec. 2001) • 3.4 Impacts to GSM( Dec. 2001, July 2002) • 3.5 Impacts to typhoon truck forecasts in GSM • 4. Summary
Numerical Forecast and Satellite Data 衛星観測データ Observation Initial Analysis Numerical Forecast Calculation Grasp the actual state of wind, temperature, humidity Numerical Prediction Model Translate into Weather Forecast
Plan to use scatterometer data for NWP FY2001 2002 2003 2004 2005 GA3DV MA4DV RA4DV GA4DV ADEOS-II/SeaWinds assimilation QuikSCAT Operational (Global) 4D-Var QuikSCAT Apply Regional Model
Assimilation of observation data for GSM 3D-Var 00UTC 3D-Var 18UTC 3D-Var 06UTC Ob.Ob. Ob. 3D-Var Early Analysis Forecast
Coverage of QuikSCAT Data used in the Cycle Analysis 2002/07/08/00UTC 2002/07/08/06UTC 2002/07/08/12UTC 2002/07/08/18UTC
Coverage of QuikSCAT Data used in the Early Analysis 2003/01/29/00UTC 2003/01/29/12UTC
The Number of QuikSCAT Data used in the Cycle and Early Analysis, respectively Cycle Analysis Early Analysis days 2003年
SCAT WIND EXTRACTION SeaWinds ambiguity winds (NESDIS L2B) [QC] Rain check,etc (Wind data in rain are not used) Ambiguity removal (NWP nudging, Median filter) [QC] Speed Check:First Guess [QC] Direction check:Group QC, Save calm wind A scatterometer wind field Thinning out windon 1x1deg grid 3D-VAR Analysis
Experiment of Assimilation and Forecast (OSE) Case 1 Case 2 Start up : 1 ~ 7 Dec. 20011~7 Jul. 2002 Period: 8 ~22 Dec. 2001 8~22Jul. 2002 9 days forecast (every 12UTC) Global Data Assimilation System • Three-dimensional Assimilation System (3D-VAR) Forecast Model T213L40 Global Spectrum Model (JMA’s Operational Model)
OSE (Observation System Experiment) Control run [Cntl] (December) Conventional data + AMW + GMS-5 Moisture Bogus + NOAA-14 + NOAA-15 (SATEM/TOVS) Control run [Cntl] (July) Conventional data + AMW + NOAA-14 + NOAA-15 (SATEM/TOVS) Test run : [Only Wind] Control + QuikSCAT/SeaWinds (only surface wind) (no ERS-2/AMI data in Cntl & Test)
SCAT WINDS(Speeds) Compared to Fist Guess(Dec., ’01, July ’02) Speed 8-22 Dec. Speed 8-22 July N=537134 N=528941 SCAT WIND RMSE RMSE 1.91 m/s 1.87m/s BIAS BIAS 0.81 m/s 0.66 m /s First Guess (m/s) First Guess
SCAT WINDS(Speeds) Compared to Fist Guess( 8 – 22 Dec., ’01) Number SCAT Winds First Guess First Guess Histogram SCAT Winds Speed(m/s) Reject Number SCAT Winds All Observation RMSE ー First Guess 1.91 m/s BIAS Histogram 0.81 m/s Reject (m/s)
SCAT WINDS(Speeds) Compared to Fist Guess( 8 – 22 July, ’02) Number SCAT Winds First Guess First Guess Histogram SCAT Winds Speed(m/s) Reject 個数 SCAT Winds All Observation RMSE ー First Guess 1.87 m/s BIAS Histogram 0.66 m/s Reject (m/s)
SCAT WINDS(Dir.) Compared to Fist Guess(Dec., ’01, July ’02) Dir. 8-22 Dec. Dir. 8-22 July N=537134 N=528941 SCAT Wind RMSE RMSE 20.18 deg 19.70 deg. BIAS BIAS 0.81 deg. 0.06 deg. First Guess First Guess
SCAT WINDS(Dir.) Compared to Fist Guess( 8 – 22 Dec., ’01) Number SCAT Winds SCAT Winds First Guess Histogram First Guess Dir. (deg.) Reject Number SCAT Winds RMSE All Observation ー First Guess 20.18(deg.) BIAS Histogram 0.81(deg.) Reject
SCAT WINDS(Dir.) Compared to Fist Guess( 8 – 22 July, ’02) Number SCAT Winds SCAT Winds First Guess Histogram First Guess Reject Dir. (deg.) Number SCAT Winds RMSE All Observation ー First Guess 19.70(deg.) BIAS Histogram 0.06(deg.) Reject
The Results of Comparison of SCAT Winds and First Guess Speed : RMSEaround 1.9 m/s BIAS 0.6 ~ 0.8 m/s Direction: RMSE around 20 deg. BIASalmost zero
A Example of OSE (1 Dec. 2001) ①Effect of SCAT Winds 6 hours Forecast (initial :18UTC Nov. 30) (First Guess) altitude pressure temperature ・ ・ SCAT Winds+Conventional data Assimilation Conventional data Assimilation CNTL TEST Effect of SCAT Winds(TEST – CNTL)
Effect of altitude at 1000hPa(00UTC 1 Dec. 2001) SCAT Winds Change of altitude and wind at 1000hPa(TEST-CNTL)
Effect of altitude at 500hPa(00UTC 1 Dec. 2001) SCAT Winds Change of altitude and wind at 500hPa(TEST-CNTL)
Effect of temperature at 500hPa(00UTC 1 Dec. 2001) SCAT Winds Change of Temperature at 500hPa(TEST-CNTL)
Result of OSE (CASE 1) Start up : 1 ~ 7 Dec. 2001 Period : 8 ~22 Dec. 2001 9 Days Forecast (every 12UTC) Global Data Assimilation System • Three-dimensional Assimilation System (3D-VAR) Forecast Model T213L40 Global Spectrum Model (JMA’s Operational Model)
P(surface)(RMSE) (8 – 22 Dec. 2001) test cntl Global N.H. RMSE Increase E.Q. S.H.
P(surface)(BIAS) (8 – 22 Dec. 2001) test cntl Global N.H. BIAS Decrease BIAS Increase E.Q. S.H.
Wind Speed(surface)(RMSE) (8 – 22 Dec. 2001) test cntl Global N.H. E.Q. S.H.
Wind Speed(surface)(BIAS) (8 – 22 Dec. 2001) test cntl Global N.H. BIAS Increase E.Q. S.H.
850hPa Altitude(RMSE) (8 – 22 Dec. 2001) test cntl Global N.H. RMSE Increase E.Q. S.H.
850hPa Altitude(BIAS) (8 – 22 Dec. 2001) test cntl Global N.H. BIAS Decrease E.Q. S.H.
850hPa Temperature(RMSE) (8 – 22 Dec. 2001) test cntl Global N.H. E.Q. S.H.
850hPa Temperature(BIAS) (8 – 22 Dec. 2001) test cntl Global N.H. E.Q. S.H.
500hPa Altitude(RMSE) (8 – 22 Dec. 2001) test cntl Global N.H. RMSE Increase E.Q. S.H.
500hPa Altitude(BIAS) (8 – 22 Dec. 2001) test cntl Global N.H. BIAS Decrease E.Q. S.H.
500hPa Temperature(RMSE) (8 – 22 Dec. 2001) test cntl Global N.H. E.Q. S.H.
500hPa Temperature(BIAS) (8 – 22 Dec. 2001) test cntl Global N.H. E.Q. S.H.
The Summary of Comparison of TEST and CNTL to Initial Value (Dec. 2001) BIAS N.H. T.R. S.H. Psurf Almost Same Negative Decrease Negative Increase Z850 Almost Same Negative Decrease Almost Same Z500 Almost Same Negative Decrease Almost Same Wsurf Almost Same Negative Increase Almost Same T850 Almost Same Almost Same Almost Same T500 Almost Same Almost Same Almost Same
The Summary of Comparison of TEST and CNTL to Initial Value (Dec. 2001) RMSE N.H. T.R. S.H. Psurf Almost Same Almost Same Slightly Increase Z850 Almost Same Almost Same Slightly Increase Z500 Almost Same Almost Same Slightly Increase Wsurf Almost Same Almost Same Almost Same T850 Almost Same Almost Same Almost Same T500 Almost Same Almost Same Almost Same
Z500hPa Anomaly Correlation (8 – 22 Dec. 2001) N.H. S.H. Accuracy decrease test cntl E.Q.
P(surface) Anomaly Correlation (8 – 22 Dec. 2001) N.H. S.H. Accuracy decrease test cntl Accuracy Increase E.Q.
Comparison of the experimental results with radiosonde observations(Z850, December 2001) N.H. RMSE BIAS TEST CNTL Forecast hours E.Q. S.H. Red: TEST Green: CNTL Scatter diagram
Comparison of the experimental results with radiosonde observations(Z500, December 2001) N.H. RMSE BIAS TEST CNTL Forecast hours E.Q. S.H. Red: TEST Green: CNTL Scatter diagram
Comparison of the experimental results with radiosonde observations(T850, December 2001) N.H. BIAS RMSE TEST CNTL Forecast hours E.Q. S.H. Red: TEST Green: CNTL Scatter diagram
Comparison of the experimental results with radiosonde observations(T500, December 2001) N.H. RMSE BIAS TEST CNTL Forecast hours E.Q. S.H. Red: TEST Green: CNTL Scatter diagram
The Summary of Comparison of TEST and CNTL to Radiosonde (Dec. 2001) RMSE N.H. T.R. S.H. Z850 Slightly Decrease Slightly Decrease Almost Same Z500 Slightly Decrease Almost Same Almost Same T850 Almost Same Almost Same Almost Same T500 Slightly Decrease Slightly Decrease Almost Same
Result of OSE (CASE 2) Start up : 1~7 Jul. 2002 Period : 8~22Jul. 2002 9 Days Forecast (every 12UTC) Global Data Assimilation System • Three-dimensional Assimilation System (3D-VAR) Forecast Model T213L40 Global Spectrum Model (JMA’s Operational Model)
P(surface)(RMSE) (8 – 22 July 2002) test cntl Global N.H. E.Q. S.H.
P(surface)(BIAS) (8 – 22 July 2002) test cntl Global N.H. BIAS Increase E.Q. S.H.
Wind Speed(surface)(RMSE) (8 – 22 July. 2002) test cntl Global N.H. E.Q. S.H.
Wind Speed(surface)(BIAS) (8 – 22 July. 2002) test cntl Global N.H. BIAS Increase E.Q. S.H.
850hPa Altitude(RMSE) (8 – 22 July. 2002) test cntl Accuracy Increase Global N.H. E.Q. S.H.