Download
1 / 62
620 likes | 760 Vues
Clinical & Community Collaboration to Combat Obesity. Cindy Wolff, PhD, MPA, RD Nutrition and Food Sciences, CSUC OPT for Fit Kids Director . Clinical & Community Collaboration to Combat Obesity. • Cindy Wolff, PhD, MPA, RD • Carol Lams MA, RD

E N D
Clinical & Community Collaboration to Combat Obesity Cindy Wolff, PhD, MPA, RD Nutrition and Food Sciences, CSUC OPT for Fit Kids Director
Clinical & Community Collaboration to Combat Obesity • Cindy Wolff, PhD, MPA, RD • Carol Lams MA, RD Director Outreach Coordinator • Faye Johnson, EdD, RD • Michele Buran Awareness Campaign Director Exercise Physiologist • Kristin Gruneisen, MS, RD • Regina Munster, MS Clinical Dietitian Nutritionist
Obesity is Changing Human Shape1980: Male - 73 kg (162#); Female - 62 kg (136#) 2000: Male - 82 kg (180#); Female - 69 kg (152#)
>33% of US Adults Are Obese • In 1983, only 15% were obese.
80%?! Are Now Overweight • We are not only fat, but we are getting fatterfast: • 1983: 58% were overweight • 1990: 64% • 1995: 71% • 2002: 80%
Meet Generation Xcess
School-Age Children • In 2000, 26% were either: • Obese (11%) or • Overweight (15%) • When today’s 50 year olds were 10, only 4% of kids were overweight vs 26% today.
Ethnic Group 24-35 mo. 36-59 mo. 5-9 yr. White 6.2 8.3 11.4 Hispanic 10.0 13.4 19.8 Asian 11.3 12.8 15.2 Rate of Overweight (% Obesity) in Low-Income Butte County Children *PedNSS data for years 1995, 1996, 1998, & 1999 were used to calculate mean rates.
Butte County PedNSS Data Ages 5-9 yrs.
Butte County WIC Study • N = 131 mothers and preschoolers • 45% of moms had some college (or more) • Half of mothers of overweight children indicated that their children were normal weight • Overweight among preschoolers was associated with more frequent fast food
Gridley Schools Data (n=554) • Mean age = 9 yrs • > 85% BMI-for-age = 52% • > 95% BMI-for-age = 30% • Double the national average
“Acanthosis Nigricans” signals high insulin levels & can help identify persons who run the risk of developing diabetes
Acanthosis Nigricans • 12% are positive for acanthosis • 1 out of 8 kids • 22% if >85% BMI-for-age • 36% if > 95% BMI-for-age • >90% of these kids are Hispanic
MNT for Aganthosis Nigricans Dietitians can conduct 2 evaluations and 4 intervention sessions with the child and family under CPT code 701.2 “Acquired Acanthosis Nigricans”
The 4th Law of ThermodynamicsorLife Isn’t Fair The Theory Dietary Intake - Energy Expenditure = Energy Stores Including Adipose Tissue The Truth (Dietary Intake x Genetic Modifier) - (Energy Expenditure x Genetic Modifier) = Energy Stores Including Adipose Tissue
FAST FOOD: An Attractive Nuisance • Americans spend more money on fast food than they do on: • higher education, • computers & software, or • new cars • And more on fast food than on movies, books, magazines, newspapers, videos and recorded music - combined.
July 28, 2002 California’s Official Drive-Through Day!!! • Jack in the Box lobbied heavily for this state declaration. • Gov Davis agreed • With 24 hr service at drive-throughs, there’s no time that fast food is out of reach.
Healthy People 2010 The Leading Health Indicators are: 1. Physical Activity 2. Overweight & Obesity 3. Tobacco Use 4. Substance Abuse 5. Responsible Sexual Behavior 6. Mental Health 7. Injury and Violence 8. Environmental Quality 9. Immunization 10. Access to Health Care
Childhood ObesityThe Problem • Considering childhood obesity is a new concept • Little to no mention in textbooks • Physicians don’t always address the issue • Why address the issue if there is no effective treatment?
CA Obesity Prevention Initiative survey results: • 90% of medical directors indicated a need for provider resources, e.g. a toolkit & training for obesity prevention & treatment • 100% reported a need for patient resources for teens & children - Jan. 2003
OPT for Fit Kids: A Community Network Approach to Child Obesity • Cindy Wolff, PhD, MPA, RD • Carol Lams MA, RD Director Outreach Coordinator • Faye Johnson, EdD, RD • Michele Buran Awareness Campaign Director Exercise Physiologist • Kristin Gruneisen, MS, RD • Regina Munster, MS Clinical Dietitian Nutritionist
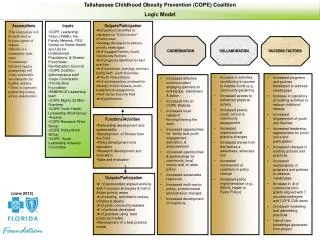
OPT Mission • To reduce the incidence of pediatric overweight through: • increased public awareness of the severity of the problem, & • by providing nutrition educationprevention and treatment services.
OPT for Fit Kids Program Components • MedicalNutrition Therapy: Nutrition assessment and counseling services for overweight children and their families.
OPT for Fit Kids Program Components 2. A multi-media campaign to increase awareness of the prevalence and severity of pediatric overweight and lifestyle practices for its prevention and treatment.
OPT for Fit Kids Program Components 3.Early childhood nutrition education for Head Start children, parents, and teachers.
Fitness is the FOCUS Not Weight
OPT Clinical Services • Medical nutrition therapy: • Group classes (L.E.A.P.) • Family counseling • The focus is on fitness and quality of life, not weight.
Description of OPT Participants (n=181) Note: A BMI-for-age of 20 = 85th %tile
Blood Lipids • 60% have elevated cholesterol • 42% low HDL • 51% high LDL • 33% high triglycerides • 48% had a total cholesterol/HDL ratio 4.5
Hyperinsulinemia & BMI-for-age • 66% had insulin values >12 uU/mL • Significant association between BMI-for-age and insulin values
OPT for Fit Kids Outcomes Measures • Dietary changes • Activity patterns • Fitness level • Biochemical values • BMI • Quality of life • Family communication • Knowledge & attitudes
Outcomes for OPT Weight Management Participants • 82% had a decrease in BMI • Mean decrease was 1 BMI unit • 2# weight loss with ½” gain in height
Decrease in Body Fat • % body fat decreased from 42.0% to 40.0%
Parents reported significant improvements: • My child eats more fruits & vegetables/day • Our family watches less television • My child is more likely to eat until he/she is “just satisfied” rather than very full or still hungry • Our family eats less fast food • I provide more physically active activities for my child • My child drinks less sweet beverages (juice, juice drinks, soda, Kool-Aid)
Children reported significant improvements: • I eat mainly low-fat (green light) foods • I exercise at least 60 minutes most days of the week • I eat when I’m hungry and stop when I’m satisfied • I accept my natural body-build
Needed changes:Health care providers • Health care providers need to assess BMI-for-age for at risk children • Talk to parents and child if > 85% BMI-for-age • Assess child for weight related co-morbidities • Refer for weight management services if > 95% BMI-for-age
Steps to using BMI-for-age • Obtain accurate weight and height measurements • Calculate BMI or look up on chart • Plot measurements • Interpret plotted measurements
Case Study: “Sam” • Name: Sam • Weight: 43 lb 4 oz • Height: 41.5 inches • DOB (date of birth): 1/10/1998 • DOV (date of visit): 4/18/2003