Hands On Lab Work By Boem Kim
10 likes | 200 Vues
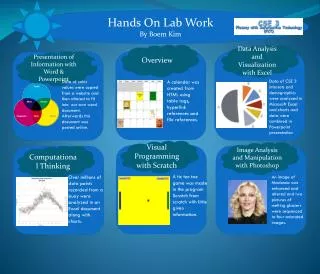
Hands On Lab Work By Boem Kim. Overview. Data Analysis and Visualization with Excel. Presentation of Information with Word & Powerpoint. Im. Data of CSE 3 interests and demographics were analyzed in Microsoft Excel and charts and data were combined in Powerpoint presentation.

Hands On Lab Work By Boem Kim
E N D
Presentation Transcript
Hands On Lab Work By Boem Kim Overview Data Analysis and Visualization with Excel Presentation of Information with Word & Powerpoint Im Data of CSE 3 interests and demographics were analyzed in Microsoft Excel and charts and data were combined in Powerpoint presentation Data of color values were copied from a website and then altered to fit into our own word document. Afterwards this document was posted online. A calendar was created from HTML using table tags, hyperlink references and file references. Visual Programming with Scratch Image Analysis and Manipulation with Photoshop Computational Thinking A tic tac toe game was made in the program Scratch from scratch with little given information. Over millions of data points recorded from a buoy were analyzed in an Excel document along with charts. An image of Madonna was enhanced and altered and two pictures of melting glaciers were sequenced to four animated images.