Download
1 / 8
240 likes | 522 Vues
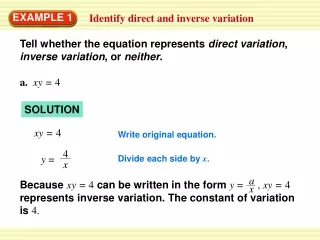
1.10 Direct Variation and Inverse Variation. Direct Variation. y varies directly as x y is directly proportional to x y = kx k is the constant of proportionality. Inverse Variation. y varies inversely as x y is inversely proportional to x. Ex. Find a mathematical model representing

E N D
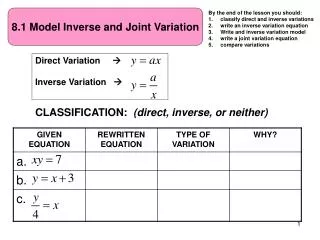
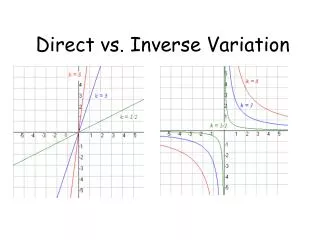
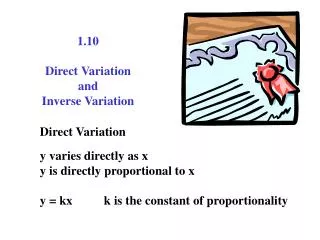
1.10 Direct Variation and Inverse Variation Direct Variation y varies directly as x y is directly proportional to x y = kx k is the constant of proportionality
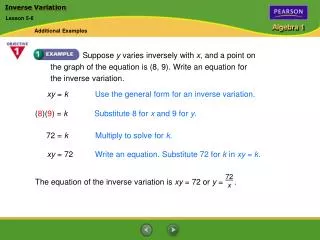
Inverse Variation y varies inversely as x y is inversely proportional to x
Ex. Find a mathematical model representing the statement. Find k. F is jointly proportional to x and the square root of y and inversely proportional to the cube of z. (F = 6 when x = 2, y = 9, and z = 3) Solve for k. k = 27
Finding a Least Squares Regression Line The amount p (in millions of dollars) of total annual prize money awarded at the Indianapolis 500 race from 1995 to 2004 are shown in the table. Construct a scatter plot that represents the data and find the least squares regression line for the data.
Year (5 = 1995) Come up with an equation that represents the points by hand and by a graphing utility. y = .268t + 6.66 y - 8.6 = .243(x - 5) or y = .243x + 6.785
TI-86 Linear Regression To input points STAT F2 (EDIT) Type in data There must be a one in the FSTAT column Quit a = y-int b = slope Corr = corr coefficient n = # of ordered pairs To get best fit line STAT F1 (CALC) F3 (linR) Enter Gives you equation of best fit line
TI - 84 press STAT arrow to calc #4 LinReg(ax + b) Press enter twice a = slope b = y-int