Download
1 / 237
2.39k likes | 2.64k Vues
EMERGENCY TRAFFIC CONTROL FOR RESPONDERS. Chapter 1 BACKGROUND. ORIGINAL DEVELOPMENT. Sponsored by the Pennsylvania DOT for the Pennsylvania State Fire Academy Available through the International Fire Service Training Association at Oklahoma State University Revised in 2006 by the

E N D
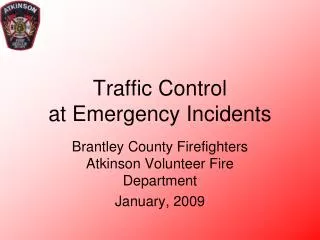
EMERGENCY TRAFFIC CONTROL FOR RESPONDERS Chapter 1 BACKGROUND
ORIGINAL DEVELOPMENT Sponsored by the Pennsylvania DOT for the Pennsylvania State Fire Academy Available through the International Fire Service Training Association at Oklahoma State University Revised in 2006 by the Kentucky Transportation Center
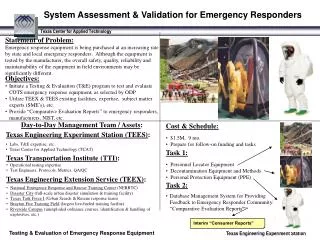
INCIDENT MANAGEMENT Our purpose is to enhance public safety and responder safety by establishing guidelines for establishing traffic control and safe traffic flow at highway incidents
COURSE OVERVIEW • Background • Guidelines and Standards • Highway Safety Principles • Traffic Control Devices • Flagging Operations • Traffic Control Zones • Incident Zone Procedures • Exercises
TYPES OF HIGHWAY INCIDENTS? • Vehicle Incidents • Temporary Highway Closures • Flooding • Fire • Storm Damage • Special Events • Detours
U.S. HIGHWAY CRASHES • Leading cause of death for people age 3 through 33 in the US • More than 42,000 deaths per year • About 117 deaths per day • About 1 death every 12 minutes 2004 Traffic Safety Facts
KY HIGHWAY CRASHES • Total number reported on public roadways – 128,685 • 29,828 nonfatal injury crashes (43,295 injuries) • 885 fatal crashes (985 fatalities) Kentucky Traffic Collision Facts, 2005
WHO IS AT RISK? • Responders • Public • “Motoring public” in traffic backlogs/detours • Other highway users • Victims of the crash/incident
HAZARDS OF RESPONDING Acceptable Levels of Risk
“STRUCK-BY” HEADLINES Some Headlines . . . The longer the crash is in place, the longer response personnel are exposed to danger. “MD Trooper Hit, Killed at Rt. 50 Crash Site” “Five Ohio Responders Struck at Highway Accident Scene” “NM Officer Recovering After Being Struck” “Maryland Firefighters Have Close Call on Washington Beltway” “Florida Firefighter Hit By Passing Car” www.respondersafety.com and www.firehouse.com
“Struck By” Fatalities • 8 Fire/EMS Fatalities (2003 Data) • 6 Firefighters and 2 EMS Personnel • 16 Law Enforcement Officers (2005 Data) Statistics Courtesy of Jack Sullivan, Training Director www.respondersafety.com www.nleomf.com
WE’RE NOT THE ONLY ONES! • A “Secondary Crash” is one that takes place as a result of traffic or road conditions caused by the original incident. • Secondary crashes are frequently much more severe than the original incident.
October 6 -7, 2004 I-64 and I-65 in Louisville A crash with 1 fatality led to two separate secondary crashes, resulting in various lane closures for approximately 18 hours
June 29, 2004 I-71 in Carroll County Driver of a tractor-trailer failed to observe stopped traffic and caused a rear-end collision involving 5 other vehicles. The driver of the tractor-trailer was fatally injured.
5 min. of stopped traffic = 15 min. of delay TRAVELER DELAY Percent Capacity Available Highway Capacity Manual 2000
TRAVELER DELAY IS COSTLY • Reduced productivity • Increased cost of goods and services • Increased fuel consumption $25.6 Billion The cost of traveler delay in 2000 1 Lane of Interstate Blocked for 20 minutes $10,000 = (LFUCG Incident Management Manual)
Quick Clearance (KRS 189.580, effective 7/06) • Four basic components to the law • Driver Stop • Driver Removal • Authority Removal • Authority Tow • Applicable to interstates and parkways
EMERGENCY TRAFFIC CONTROL FOR RESPONDERS Chapter 2 GUIDELINES AND STANDARDS
EVALUATE THIS INCIDENT SITE • CORRECT • Apparatus “shadowing” work area • Cones, signs placed • Flagger on duty • IMPROVE • Nonstandard sign • Cone placement and visibility • Lack of taper • Lack of proper equipment • Personnel visibility • Lack of lighting
WHO PROVIDES HIGHWAY STANDARDS: • Federal Highway Administration (FHWA) • State Departments of Transportation • Local Municipal Governments
STATE HIGHWAY SIGNS, SIGNALS, AND MARKINGS ARE CONTROLLED BY Legislation Kentucky Revised Statutes Kentucky Administrative Regulations
KRS 189.337 / 603 KAR 4:050 The Department of Highways shall promulgate and adopt a manual of standards and specifications for a uniform system of official traffic control devices for use upon all roads and streets. The manual and its future revisions and supplements shall be applicable to all roads and streets under the control of the Department of Highways or any county or incorporated city. The manual specified is the Manual on Uniform Traffic Control Devices, 2003 Edition, including Revision No. 1 dated November 2004
MUTCD: IT’S THE LAW (Federal) The Manual on Uniform Traffic Control Devices(MUTCD) is incorporated by reference in 23 Code of Federal Regulations (CFR), Part 655, Subpart F and shall be recognized as the national standard for traffic control devices on all public roads open to public travel in accordance with 23 U.S.C. 109(d) and 402(a). The policies and procedures of the Federal Highway Administration (FHWA) to obtain basic uniformity of traffic control devices shall be as described in 23 CFR 655, Subpart F.
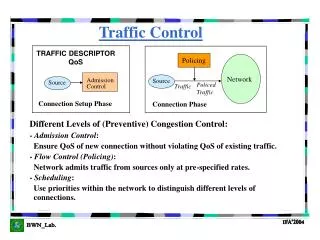
CHAPTER 6I of the 2003 MUTCD “CONTROL OF TRAFFIC THROUGH TRAFFIC INCIDENT MANAGEMENT AREAS” TRAFFIC INCIDENT: “An emergency road user occurrence, a natural disaster, or other unplanned event that affects or impedes the normal flow of traffic.” - Section 6I.01, 2003 MUTCD
CHAPTER 6I of the 2003 MUTCD • The primary function of temporary traffic control is to move road users reasonably safely and expeditiously past or around the incident, to reduce secondary crashes, and to preclude unnecessary use of the surrounding local road system. • Highway agencies, public safety agencies, and private sector responders should plan for traffic incidents.
CHAPTER 6I of the 2003 MUTCD Major provisions: • Classifies incidents by expected duration. • Recommends interagency pre-planning and management (“unified incident management”). • Traffic control “size-up” and beginning of action within 15 minutes of arrival. • “Fluorescent Pink” background/black letters permitted for signs in incident traffic control zones. • Recommendations on use of Emergency Vehicle Lighting.
CHAPTER 6I of the 2003 MUTCD Classifies incidents by expected duration. • MAJOR: over 2 hours • INTERMEDIATE: from 30 minutes to 2 hours • MINOR: under 30 minutes In general, the longer the duration, the more closely the temporary traffic control measures are expected to conform to the MUTCD. Incidents expected to last 24 hours or longer should comply with Part 6 of the MUTCD.
TO GET A COPY OF THE MUTCD Printed version: Institute of Transportation Engineers 1099 14th Street N.W. Suite 300 West Washington, DC 20005 Phone: 202-289-0222 Fax: 202-289-7722 www.ite.org Electronic version: www.mutcd.fhwa.dot.gov
EMERGENCY TRAFFIC CONTROL FOR RESPONDERS Chapter 3 HIGHWAY SAFETY PRINCIPLES
UNIFORMITY • No surprises • Driver expectancy • MUTCD and Kentucky guidelines
If a car is traveling at 55 mph, how much distance does it need to stop???
STOPPING SIGHT DISTANCE • Definition The distance traveled from the time a driver first detects the need to stop until the vehicle actually stops. • Two Components 1) Perception/Reaction Distance 2) Braking/Skidding Distance
PERCEPTION/REACTION DISTANCE Distance traveled by a vehicle from the instant the driver sees an object to the instant the brakes are applied.
WHAT IS A TYPICAL DRIVER’S PERCEPTION/REACTION TIME?? • 0.5 seconds • 1.0 seconds • 1.5 seconds • 2.5 seconds • 4.0 seconds As much as: 2.5 seconds Be prepared for drivers who do not react . . .
At 60 mph, how far will a car travel during perception/reaction time? 60 mph = 88 feet /second In 2.5 seconds, Distance =220 feet
A VEHICLE WILL TRAVEL THE FOLLOWING DISTANCES IN 2.5 SECONDS: mphfeet • 10 37 • 20 74 • 30 110 • 40 147 • 50 184 • 55 202 • 60 220 • 65 239 • 75 276 Almost the length of a football field!
BRAKING DISTANCE Distance traveled by a vehicle from the instant the brakes lock up until the vehicle stops.
A VEHICLE WILL SKID THE FOLLOWING DISTANCES: mph feet* • 10 7 • 20 38 • 30 86 • 40 154 • 50 240 • 55 290 • 60 346 • 65 405 • 75 540 *Distances are for wet weather conditions
THE TOTAL DISTANCE A VEHICLE NEEDS TO STOP AT VARIOUS SPEEDS: mph feet • 10 45 • 20 115 • 30 200 • 40 305 • 50 425 • 55 495 • 60 570 • 65 645 • 75 820 Almost 3 times the length of a football field!
AT NIGHT – HOW FAR AWAY CAN YOU SEE HEADLIGHTS?? • ½ Mile • 1 Mile • 5 Miles • 10 Miles • 20 Miles
AT NIGHT – HOW FAR AWAY CAN A DRIVER SEE YOU IN DARK CLOTHES?? Using low beams • 100 feet • 200 feet • ½ mile • 1 mile • 5 miles 300 feet with high beams
ANSI/ISEA Z 107-2004Standard on High-Visibility Safety Apparel and Headwear Four classifications of garments: • Performance Class I – low speeds, ample separation, full attention. Example: Picking up carts in shopping center parking lot. • Performance Class 2 – higher speeds, complex backgrounds, diverted attention, less traffic/work separation possible. Example –Short-term maintenance operation, firefighters engaged in emergency response activities who are wearing turnout gear. • Performance Class 3 – very high speeds, reduced sight distances, high task loads, need for conspicuity through full range of motion, need to be recognized as a person. Example – Highway Emergency Incident. • Performance Class E – trousers, bib overalls, and shorts designed for use with a Performance Class 2 or 3 garment.