Download
1 / 22
230 likes | 728 Vues
The Investment Function and Consumption as a Function of Real National Income. J.A.SACCO. Determinants of Investment. Historically Investment has been more volatile than consumption Why?. An Intro to Investments and its Determinants.

E N D
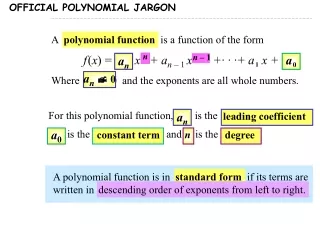
The Investment Function and Consumption as a Function of Real National Income J.A.SACCO
Determinants of Investment • Historically • Investment has been more volatile than consumption • Why?
An Intro to Investments and its Determinants Starter- What is investment in the context of consumption and GDP? C+I+G+(X-M)=GDP Real Consumption • Less variable/more consistent • Consumption expenditures are less subject on how economy looks in future • People will always spend Real Investment • More variable over time • Based on decisions of business people on variable/subjective elements of economy • Expectations play a role on the investment function-accounts for instability of investment over time.
Planned Investment Function Investment depends on the interest rate Remember the “Classical Economists” Interest Rate High/ Investment Low Interest Rate Low/Investment High Businesses have an array of investment opportunities with rates of return that are low and some high. When do you Invest? Investment is profitable if the rate of return is greater than the opportunity cost (interest rate) of the investment.
Decision to Invest The decision of a firm to invest on machinery or construction is simply a decision based upon marginal benefits and marginal costs. Marginal Benefit of an Investment -is the expected real rate of return (R) the firm anticipates receiving on the expenditure. Marginal Cost of an Investment- is the real rate of interest (I), or the cost of borrowing. Rule of Thumb If Rate of Return% > Real Rate of Interest %, make the investment. If Rate of Return% < Real Rate of Interest %, don’t make investment.
Planned Investment Schedule Planned investment Rate of Interest per Year (percent per year) ($ trillions) 15 .2 14 .3 13 .4 12 .5 11 .6 10 .7 9 .8 8 .9 7 1.0 6 1.1 i% up, Investment down i% down, Investment up
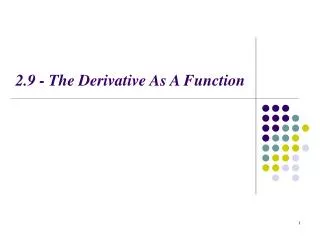
I Planned Investment Just like demand, Investment increases as the price falls. As interest rate falls more investment opportunities become more profitable, and vice-versa. 15 14 13 12 11 10 Rate of Interest (percent per year) 9 8 7 6 0 .1 .2 .3 .4 .5 .6 .7 .8 .9 1.0 1.1 Planned Investment per Year ($ trillions)
Determinants of Investment • What Causes the Investment Function to Shift? • When any non-interest rate determinant of investment changes, the investment function (I) will shift. 1) Expectations-? 2) Productive technology-? 3) Business taxes-? *Change of Interest rate will not shift the investment function. You will only move up and down the function.
I1 Graphing Changesin Investment Positive profit outlook Rate of Interest (percent per year) r1 I2 I1 I2 Planned Investment per Year ($ trillions)
r1 I1 I2 I2 I1 Graphing Changesin Investment Taxes Increase Rate of Interest (percent per year) Planned Investment per Year ($ trillions)
Consumption Function of Real National Income We’ve looked at consumption based on the level of RDI per year. This was an analysis of one person/family Now must create a consumption function model for entire macroeconomy Must make adjustments to RDI to RNI (Output)
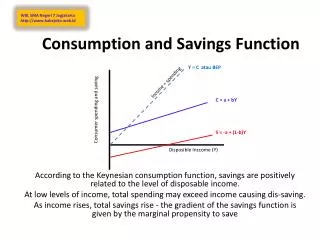
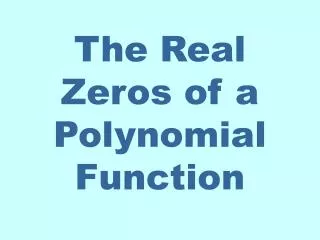
C=Y 45o reference line C Autonomous consumption 45o Consumption as a Functionof Real National Income “Y”= Real National Income (Output) Cis a function of real national income. Assume MPC = .8 2.5 2.0 Where “C” intersects the 45º Line, Consumption Expenditures equals Real National Income *all Income Consumed 1.5 Planned Consumption per Year ($ trillions) 1.0 0.5 0.3 0 0.5 1.0 1.5 2.0 2.5 Real National Income per Year (Output) ($ trillions)
Consumption as a Functionof Real National Income • The second component of private aggregate demand is investment spending, I. • Remember the equilibrium rate of interest is determined at the intersection of “desired savings”. • Saving is labeled “S” and is upward sloping.
S I Combining Consumptionand Investment The equilibrium interest rate is determined by S and I. 14 12 Rate of Interest (percent) 10 8 6 Given S & I, the interest rate = 10% and S & I = .7 trillion. 4 2 0 .3 .4 .5 .6 .7 .8 .9 1.0 1.1 Real Investment per Year ($ trillions)
$700 B. Investment per year Autonomous with respect to real national income. This investment is constant, regardless of the level of income 0.7 I I is autonomous Combining Consumptionand Investment Real Investment per Year ($ trillions) 0 1 2 3 4 5 6 7 Real National Income per Year ($ trillions)
C + I C C + I = Y 45o Combining Consumptionand Investment 6.0 5.0 4.0 Planned Consumption per Year ($ trillions) 3.0 1) C + I= total planned expenditures 2) Equilibrium: C + I = Y 3) Equilibrium Y = $5 trillion 2.0 1.0 0.3 1.0 2.0 3.0 4.0 5.0 6.0 0 Real National Income per Year (Output) ($ trillions)
Keynesian Equilibrium with Government and the Foreign Sector Added • Government (G) -- C + I + G • Federal, state, & local • Does not include transfer payments • Is autonomous • Lump-sum taxes = G • Lump-sum tax • A tax that does not depend on income or the circumstances of the taxpayer
Keynesian Equilibrium withGovernment and the Foreign Sector Added • The Foreign Sector -- C + I + G + X • Net exports (X) = exports - imports • Autonomous • Depends on the economic conditions in each country
The Determination of EquilibriumReal National Income with Net Exports 8 1 2 3 4 5 6 7 Auto 9 10 Direction 4+5Incl. Auto3-4AutoAuto Net 4+6+7+81-9 of Change Real Real Exports Total Planned Unplanned in Real National Disposable Planned Planned Planned Government (exports- Expenditures Inventory National Income Taxes Income Consumption Saving Investment Spending imports) Changes Income -.1 0 .1 .3 .5 .7 .8 .9 1.1 .1 .1 .1 .1 .1 .1 .1 .1 .1 2.0 2.5 3.0 4.0 5.0 6.0 6.5 7.0 8.0 .7 .7 .7 .7 .7 .7 .7 .7 .7 1.0 1.0 1.0 1.0 1.0 1.0 1.0 1.0 1.0 1.0 1.0 1.0 1.0 1.0 1.0 1.0 1.0 1.0 1.1 1.5 1.9 2.7 3.5 4.3 4.7 5.1 5.9 1.0 1.5 2.0 3.0 4.0 5.0 5.5 6.0 7.0 2.9 3.3 3.7 4.5 5.3 6.1 6.5 6.9 7.7 -.9 -.8 -.7 -.5 -.3 -.1 0 +.1 +.3 Increase Increase Increase Increase Increase Increase Neither Decrease Decrease
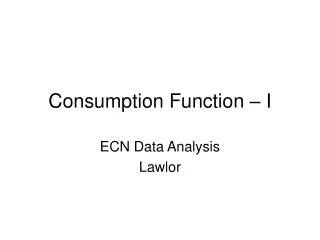
C + I + G + (X-M) E’ C E The Equilibrium Levelof Real National Income 7.0 RNI < C+I+G+X-M Less savings/more consumption causes shortage. Business increase output. 6.0 RNI > C+I+G+X-M More savings/ less consumption causes surplus. Cut back production. 5.0 Consumption, Investment, Government Purchases, and Net Exports ($ trillions) 4.0 3.0 2.0 1.0 0.3 0 1.0 2.0 3.0 4.0 5.0 6.0 7.0 8.0 RealNational Income per Year (Y) ($ trillions)
The Equilibrium Levelof Real National Income • Observations • If C + I + G + X = Y (RNI) • Equilibrium • If C + I + G + X > Y (RNI) • unplanned drop in inventories (shortage/negative) • businesses increase output • Y returns to equilibrium • If C + I + G + X < Y • unplanned rise in inventories (surplus/positive) • businesses cut output • Y returns to equilibrium *Note equilibrium IS NOT full employment/potential of the economy
The Equilibrium Levelof Real National Income How does our study of Consumption, Real National Income, and Equilibrium help in Macroeconomics?