Understanding Sample Size and Confidence Intervals for Accurate Population Insights
This text explores the relationship between sample size and confidence intervals in statistical analysis. It emphasizes that larger sample sizes lead to more precise estimates, which in turn result in smaller confidence intervals. The discussion includes details on different confidence levels (e.g., 95% and 99%) and the associated alpha values. It uses a dartboard analogy to illustrate the trade-off between precision and confidence, highlighting how a smaller interval indicates higher confidence in the estimate.

Understanding Sample Size and Confidence Intervals for Accurate Population Insights
E N D
Presentation Transcript
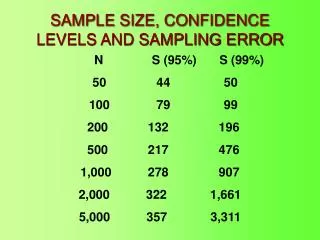
When I cover the entire population I get to know the truth – precisely. • That means that when my sample size is high I get a more precise answer. • That means that when my sample size increases my preciseness increases • That means that when my sample size increases my confidence interval becomes smaller
Confidence level .95 or 95% Alpha .05 Confidence level .99 or 99% Alpha .01
Confidence level Confidence Interval I am less confident of throwing inside the inner rings which represent small interval (think: confidence interval) I am more confident of throwing a dart any where on this dartboard which represents bigger interval (think: high confidence interval). Implies that I have higher confidence in making in the higher confidence interval
Confidence level .95 or 95% Alpha .05 Confidence interval