Confidence Interval Behavior and Sample Size
Confidence Interval Behavior and Sample Size. Presentation 7.2. Structure of the Confidence Interval. Margin of Error. The standard deviation of the estimate. An estimate for μ from your sample. Based on level of confidence, how many standard deviations away you can tolerate.

Confidence Interval Behavior and Sample Size
E N D
Presentation Transcript
Confidence Interval Behavior and Sample Size Presentation 7.2
Structure of the Confidence Interval Margin of Error The standard deviation of the estimate. An estimate for μ from your sample Based on level of confidence, how many standard deviations away you can tolerate
What Can You Control? • Given the structure of the confidence interval, what do you have the power to change? • The sample mean? • z*? • The population standard deviation? • The sample size?
What Can You Control? • z* • Remember that z* is based upon the level of confidence. • The statistician chooses the level of confidence. • Sample size • The statistician chooses the sample size.
Margin of Error • The margin of error and interval width are affected by the choices of confidence level and sample size.
Choosing a Level of Confidence • What happens as your level of confidence goes up? • z* increases • Margin of error increases • Interval width increases • What happens as your level of confidence goes down? • z* decreases • Margin of error decreases • Interval width decreases
Select values of z * • Confidence Levels and z* • As confidence level goes up, z* goes up • As confidence level goes down, z* goes down
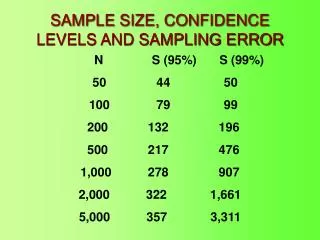
Choosing Sample Size • What happens as your sample size goes up? • Margin of error decreases • Interval width decreases • This makes sense, bigger sample size, more accurate estimate • What happens as your sample size goes down? • Margin of error increases • Interval width increases • This makes sense, smaller sample size, less accurate estimate
Example Problem #1 • Suppose a 95% confidence interval for μ is (4.2, 4.8). • What’s the width of this interval? 4.8 – 4.2 = 0.6 • What is the sample mean? It must be in the middle, so 4.5. • What is the margin of error? You must be adding / subtracting 0.3 from 4.5 to get the interval, so the margin of error is 0.3.
Finding the sample size. Earlier we obtained a confidence interval for the mean fuel capacity of a certain model of car. In that example, we were given the sample size of 40. This time, suppose that we want to obtain a 90% confidence interval for μ and σ and we want the margin of error to be 0.2.
7 This is the margin of error (E) and we want it to be 0.2. After you substitute everything that you know into the equation, solve for n. This means we need at least a sample of size 829 to achieve this margin of error.
Finding the desired sample size for proportions Here, you have to estimate p-hat from a smaller sample size, perhaps a pilot study. In most cases, 0.5 is used in place of p-hat because this is the worst case scenario (generates the largest error that might be expected).
Confidence Interval Cautions • Don’t suggest that the parameter varies. • There is a 95% chance the true proportion (or mean) is between .31 and .36. • It sounds like the true proportion (or mean) is wandering around. • The true p (or mu) is fixed, not random. • Don’t claim that other samples will agree with yours. • 95% of all possible intervals will contain the population parameter. • One is not more right than another (at least not that we could tell).
Confidence Interval Cautions • Don’t be certain about the parameter • Don’t say, “The effective rate is between 91 and 94.” • This makes it seem like the true population parameter (mean or proportion) could never be outside this range. • We are not sure of this, just “kind-of” sure (think level of confidence). • The confidence interval is about the parameter not the statistic. • Never, ever say, “We are 95% sure the sample proportion (or mean) is between .37 and .42.” • There is NO uncertainty in this, it HAS to be true. • The sample proportion (or mean) is always in the confidence interval; isn’t the confidence interval created around the sample?
More Confidence Interval Behavior • Remember the trade-off between reliability (confidence level) and the width of the interval. • Increasing the confidence level means the interval width becomes greater (wider). • By increasing the sample size, n, the interval becomes narrower. • How big should the sample size be to get useful, precise information about the population? • How confident should we be to get useful, precise information about the population?
Confidence Interval Behavior and Sample Size • This concludes this presentation.