Analyzing RV Ownership: Data-Driven Decision on Vacationing
In August 1990, a campground inquiry sparked a data-driven investigation into RV ownership. Faced with the question, "Does everyone else have RVs?" we collected and analyzed vehicle data during our trip to Yellowstone. Our sample revealed that only 6% to 9.6% of people own RVs, leading us to conclude that RV ownership is below 50%. This confidence interval gives us a 95% assurance that the majority of travelers do not have RVs, essentially saving us from an unnecessary purchase. We leveraged data analysis to make an informed decision about vacations.

Analyzing RV Ownership: Data-Driven Decision on Vacationing
E N D
Presentation Transcript
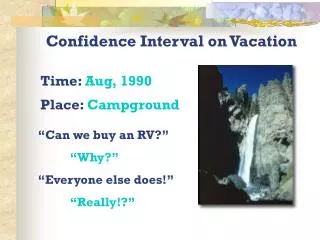
Confidence Interval on Vacation Time: Aug, 1990 Place: Campground “Can we buy an RV?” “Why?” “Everyone else does!” “Really!?”
Let us collect some data! My Favorite Recipe : • Question • Data • Analysis • Conclusion
Decision Through Data! Question: “Does everyone else have RV’s?” If p>0.5, we will buy an RV! Data: To and from Yellowstone, tallied all vehicles in the opposite direction.
Analysis:x = 67RV’s n = 857vehicles sample proportion is: CI for p is: Conclusion: There is strong evidence for p<0.5. Less than 50% people have RV’s! $ saved!
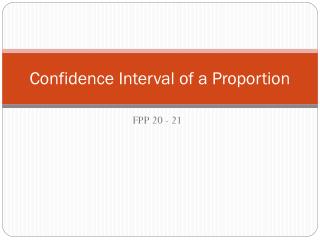
Confidence Interval to find the true proportion of RV’s: p = ? Analysis:x = 67RV’s n = 857vehicles We want 95% confidence. Conclusion: We are 95% Confident that the true p = (0.078±0.018)! Only 6% to 9.6% people have RV’s! $ saved!