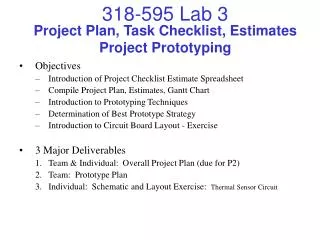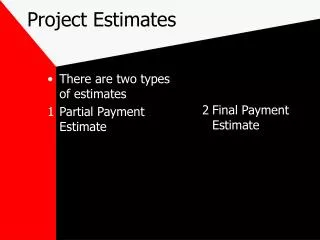

Project Estimates Are probabilistic Statements
E N D
Presentation Transcript
Project Estimates Are probabilisticStatements Martin Shepperd Brunel Software Engineering Research Centre (B-SERC) Brunel University Martin.Shepperd@brunel.ac.uk people.brunel.ac.uk/~csstmms/
1. Background 2. Expert judgement 3. Group techniques 4. Observing groups 5. Discussion Overview
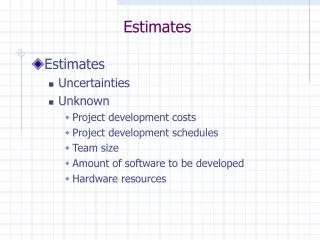
1. Background • Software developers need to predict, e.g. • effort, duration, number of features • defects and reliability • But ... • little systematic data • noise and change • complex interactions between variables • poorly understood phenomena
Current Approaches • Expert judgement • Off-the-shelf parametric models e.g. COCOMO, etc. • Develop a (simple) local model e.g. LSR • “Zingy” methods • Combination
Some Causes of Poor Estimation • We don’t cope with political problems that hamper the process. • We don’t develop estimating expertise. • We don’t systematically use past experience. Tom DeMarco Controlling Software Projects. Management, Measurement and Estimation. Yourdon Press: NY, 1982.
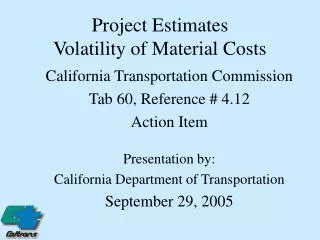
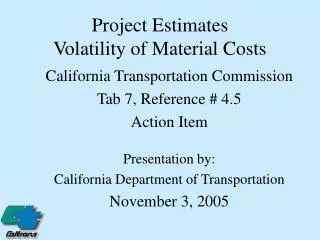
An estimate is a prediction based upon probabilistic assessment. most likely p equal probability of under / over estimate 0 effort So What is an Estimate?
Alternatives to point values include: 3 point estimates range and confidence level e.g. 90% confident that the duration will be between 10 and 15 weeks. Points or Distributions?
Studies report that many experts over estimate their confidence levels / select too narrow a range. Experience can exacerbate the problem. Also asymmetric distribution of errors. Over confidence
Training (including probability) and feedback. Experience can exacerbate the problem. Also asymmetric distribution of errors. Useful Responses
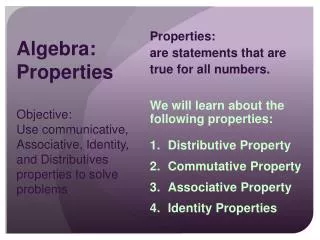
( Defining “Good” Prediction ) Many criteria to judge a prediction system: • accuracy (centre, bias, spread) • ease of use • explanatory value • sensitivity • demand for training data • adaptability • etc.
2. “Expert Judgement” • Most widely used estimation technique • No consistently “best” prediction system • Lack of historical data • Need to “own” the estimate • Experts plus … ?
BUT Lack of objectivity Lack of repeatability Lack of recall /awareness Lack of experts! Expert Judgement Drawbacks Preferable to use more than one expert.
What do We Know About Experts? • Most commonly practised technique. • Dutch survey revealed 62% of estimators used intuition supplemented by remembered analogies. • UK survey - time to estimate ranged from 5 minutes to 4 weeks. • US survey found that the only factor with a significant positive relationship with accuracy was responsibility.
Information Used • Design requirements • Resources available • Base product/source code (enhancement projects) • Software tools available • Previous history of product • ... Bob Hughes, Information & Software Techmology 38(2) pp67-75
Information Needed • Rules of thumb • Available resources • Data on past projects • Feedback on past estimates • ...
Feedback Key: fr - final report lm - line management none reviews vl - very little
3. Group Techniques • “Two” experts are better than one • synergy • coverage • transfer expertise • group “ownership”
Other Group Techniques Brainstorming - to identify full list of possibilities e.g. opportunities / threats Nominal group techniques - silent generation of ideas, round robin sharing of one idea at a time. Each idea then discussed. Spontaneous evaluation. Silent voting.
Delphi Techniques Methods for structuring group communication processes to solve complex problems. Characterised by iteration anonymity Devised by Rand Corporation (1948). Refined by Boehm (1981).
1. Experts receive spec + estimation form 2. Discussion of product + estimation issues 3. Experts produce individual estimate 4. Estimates tabulated and returned to experts 5. Only expert's personal estimate identified 6. Experts meet to discuss results 7. Estimates are revised 8. Cycle continues until an acceptable degree of convergence is obtained Stages for Delphi Approach
Wideband Delphi Form Project: X134Date: 3/10/05 Estimator: MJS Estimation round: 1 0 10 20 30 40 50 x x* x x! x x x Key: x= estimate;x* = your estimate;x!= median estimate
Delphi Objectives • Obtain informed judgement • Consensus judgement (not essential) • Educate participants, especially if multi-disciplinary / diverse inputs Devised by Rand Corporation (1948). Refined by Boehm (1981).
4. Observational Study • Many text books refer to Delphi as a prediction technique. • Unaware of any published studies. • So, an empirical study but not a formal experiment. • Quantitative and qualitative data.
Observing Delphi Groups • Four groups of MSc student (replicated at UMD - thank you Shari Pfleeger) • Developing a C++ prototype for some simple scenarios • Requested to estimate size of prototype (number of delimiters) • Initial estimates followed by 2 group discussions • Recorded group discussions plus scribes
Delphi Size Estimation Results Absolute residuals Estimation Mean Median Min Max Initial 371 160.5 23 2249 Round 1 219 40 23 749 Round 2 271 40 3 949
Converging Group Group A
A Dominant Individual Group D
Qualitative Analysis • What, how and when • Group behaviour and attitudes • Differences between “successful” and “unsuccessful” groups
Assumptions J: “Can we reuse stuff?” J: “Assume we have access to a dbms.” N: “We've made different assumptions. Lots of estimates are 1500.” Exploring assumptions was a major preoccupation for 3 out of 4 groups (A, B and D) Most frequent as scoping (early in discussion) or triggered by comparison with other estimates
Comparing I: “How is the median 275? What are the others thinking?” Discussion as to whether to use the estimates from outside the group. All a little surprised by the other estimates … J begins to question some of his assumptions. Unsurprisingly comparing estimates was also a major preoccupation for all groups. Range of reactions - defensive / open
Estimation Heuristics Decide to start with code size estimation task as easier. However, AJ then began to try to justify his own estimate, using an essentially bottom-up approach. N: “What about the limits of the time scale, we only have 3 days.” J: “TD [lecturer] says to add 20% to any estimate”
Sizing N: “We could use count of button/text boxes to generate estimates.” AJ then tried to estimate the size of product in terms of classes and variables. He estimated 30 variables and 8 to 9 classes. The technique used was again to think in terms of an estimated number of functions and then use this to gain a figure for lines of code. All groups tried to estimate by using different units of size to LOC.
Analogies Group identify assignment from M [lecturer] as another source of data. Main driver was about 80 LOC. B: “it was a bit like the linked list assignment and a bit more”. AJ: ... in his experience the rate at which he could write code (i.e., code that worked), was about ten statements in 5 hours. Groups A and B made extensive use of a range of analogies
Information Needs What would be really useful would be to know how the other groups had arrived at their figures. In other words they wanted to gauge the strength of their arguments. J: can't get a very detailed breakdown even for low complexity project. Relatively few comments about the need for additional information. Perhaps resigned or perhaps due to the teaching context.
Following J: acknowledges they are far from expert, and so could be unduly influenced by other people's figures/suggestions. AJ appeared completely unconvinced by this, but said that he was “not prepared to stand by the [his] figures”. They both seemed to be happy to be persuaded by others, allowing for their own inexperience (as if the others were somehow collectively more experienced). Groups B and D exhibited “following” behaviour.
Dominating I: gave a figure ... other stated whether they were higher or lower. He then said how he had arrived at the figure, the others approved his method. J: gave his methods for working out the estimate, again general approval (did not discuss why their figures were different). The experienced team member [E] said he has never worked on something that took longer than three months. The non-experienced didn’t even ask him if he worked on a group project. Groups C and D exhibited “dominating” behaviour.
Co-operating N: Don't feel pressurised [to change estimate] Groups A and C most obviously exhibited co-operation.
Differences Between Groups • Groups A, B and C improved their estimates but Group D diverged. • A, C and D all had “natural” leaders but D was allowed to dominate. • Other members of D tended towards apathy. • Group D make least overt use of analogies, sizing or estimation heuristics other than contingency. • Group D appeared least confident.
5. Discussion • In general, group estimating (a variant of Delphi) improved the accuracy of size estimates. • Subjects tended to gain in confidence (pre and post questionnaires). • But, a small study using students and a relatively constrained estimation task.
Negative Factors • One group (D), were led away from the true figure (repeated at UMD). • The other members allowed one individual to dominate. • The poorest predictions were characterised by least overt use of heuristics and sizing and, encouragingly least, confidence. • Group D were defensive when comparing their estimates with those of others.
Experts plus … ? • Experiment by Myrtveit and Stensrud using project managers at Andersen Consulting • Asked subjects to make predictions • Found expert+tool significantly better than either expert or tool alone. • What type of prediction systems are easiest to collaborate with?
Future Avenues • Great need for useful prediction systems • Consider the nature of the prediction problem • Combining prediction systems • Collaboration with experts • Managing with little or no systematic data