Singular Value Decomposition applied on altimeter waveforms
Singular Value Decomposition applied on altimeter waveforms. P. Thibaut, J.C.Poisson, A.Ollivier : CLS – Toulouse - France F.Boy, N.Picot : CNES – Toulouse - France. Context of the study.

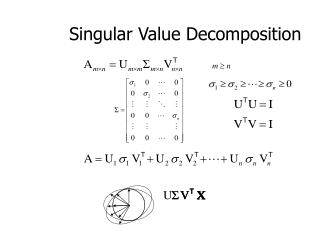
Singular Value Decomposition applied on altimeter waveforms
E N D
Presentation Transcript
Singular Value Decomposition applied on altimeter waveforms P. Thibaut, J.C.Poisson, A.Ollivier : CLS – Toulouse - France F.Boy, N.Picot : CNES – Toulouse - France
Context of the study • The altimetry technique is based on the exploitation of high rate waveforms measured by a pulse limited radar (Pulse Repetition Frequency around 2000Hz). These waveforms are corrupted by multiplicative speckle noise. • In order to be able to provide useful information to the users, waveforms are averaged to reduce their noise level. The estimation process called retracking is performed at a low rate (20Hz) fitting an ocean model (Hayne model) to these waveforms (LSE). • Then, the 20-Hz estimates are averaged to derive 1Hz values for significant waveheight, range and sigma naught coefficients. • We propose here to reduce the noise level of the estimations without any artificial along-track spatial correlation introduced by the 1Hz averaging, … • A Singular Value Decomposition is implemented to reduce the noise level of the WFs before the estimation procedure (which is unchanged wrt current procedure) Igarss 2011 – Vancouver – Pierre THIBAUT
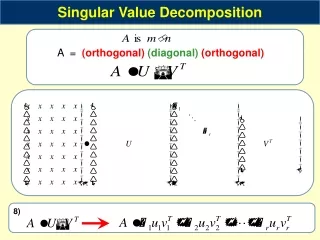
Truncated Singular Value Decomposition for Noise Reduction • Classical technique in signal processingsometimesused to « denoise » signals. • Waveformsfilteringusing SVD was first investigated by A.Ollivierin hisPhDThesis (2006) withveryencouragingresults on Poseidon and Jason-1 altimeter data • The processingconsists in : J1 Ku band filteredwaveforms Taking the S matrixrepresenting the noisy signal (Wfsmatrix) S= S + B J1 Ku band rawwaveforms Computing the Singular Value Decomposition S= USV* SVD filtering S (m,n) : WF matrix (m= 104; n=300) U (m,m), V*(n,n): unit matrices S (m,n) : diagonal matrix Waveform index gate index S= l1VS1+….+lkVSk+…..lrVSr Waveform index gate index noise signal + noise Discardingsmallsingular values of S (whichmainlyrepresent the additive noise) The rank-k matrixAkrepresents a filtered signal Igarss 2011 – Vancouver – Pierre THIBAUT
Class 1 Class 2 Class 3 Class 4 Class 5 Class 6 Brown echos Peak echos Very noisy echos Linear echos Peak at the end of the echos Very large peak echos Class 12 Class 23 Class 13 Class 24 Class 15 Class 0 Brown + Peaky echos Peaky + Noise Brown + leading edge perturbation Brown + Peaky + linear variation Brown + increasing leading edge CS 32 Class 21 Class 35 Class 16 Class 99 ?? Doubt Brown + strong decreasing plateau Brown + Peak echos Leading at the end + noise Truncated Singular Value Decomposition for Noise Reduction • matricialmethod • results are closelylinked to the size of the matrix (number of Along-TrackWfs in the matrix) • and the homogeneity of the waveformmatrix • results are closelylinked to rank-k truncation Waveforms classification SVD Estimation Process (retracking) Igarss 2011 – Vancouver – Pierre THIBAUT
Parameters used for the SVD noise reduction • Selection of the waveforms using a classification method Class 1 Class 12 Class 15 Class 16 Class 2 Class 3 Igarss 2011 – Vancouver – Pierre THIBAUT
Parameters used for the SVD filtering • Determination of the truncature threshold • Investigations on the frequential spectrum of the SLA residuals (SLAProducts – SLASVD) 96 % threshold • SLA Products • SLA SVD • Residuals 10km 700m Igarss 2011 – Vancouver – Pierre THIBAUT
Parameters used for the SVD filtering • Determination of the truncaturethreshold • Investigations on the frequentialspectrum of the SLA residuals (SLAProducts – SLASVD) 92 % threshold • SLA Products • SLA SVD • Residuals 10km 700m Igarss 2011 – Vancouver – Pierre THIBAUT
Parameters used for the SVD filtering • Determination of the truncature threshold • Investigations on the frequential spectrum of the SLA residuals (SLAProducts – SLASVD) 90 % threshold • SLA Products • SLA SVD • Residuals 10km 700m Igarss 2011 – Vancouver – Pierre THIBAUT
Parameters used for the SVD filtering • Determination of the truncature threshold • Investigations on the frequential spectrum of the SLA residuals (SLAProducts – SLASVD) 88 % threshold • SLA Products • SLA SVD • Residuals 10km 700m Igarss 2011 – Vancouver – Pierre THIBAUT
Parameters used for the SVD filtering • Determination of the truncature threshold • Investigations on the frequential spectrum of the SLA residuals (SLAProducts – SLASVD) 84 % threshold • SLA Products • SLA SVD • Residuals 10km 700m Igarss 2011 – Vancouver – Pierre THIBAUT
Parameters used for the SVD filtering • Determination of the truncature threshold • Investigations on the frequential spectrum of the SLA residuals (SLAProducts – SLASVD) 80 % threshold • SLA Products • SLA SVD • Residuals 10km 700m Igarss 2011 – Vancouver – Pierre THIBAUT
Truncated Singular Value Decomposition Noise Reduction J1 Ku band raw waveforms J1 Ku band filtered waveforms Waveform index Waveform index gate index gate index
Truncated Singular Value Decomposition for Noise Reduction Raw waveforms Filtered waveforms Igarss 2011 – Vancouver – Pierre THIBAUT
Impact on range (threshold of 84 %) SLA spectrum – Ku band SLA variation MLE4 SVD+MLE4 MLE4 SVD+MLE4 10km 700m latitude 8 cm at 20 Hz 5 cm at 20 Hz Igarss 2011 – Vancouver – Pierre THIBAUT
Impact on range (threshold of 90 %) SLA spectrum – Ku band SLA variation - SLA Prod - SLA SVD 10km 700m 8 cm at 20 Hz 7 cm at 20 Hz Igarss 2011 – Vancouver – Pierre THIBAUT
Impact on range (threshold of 90 %) Results on Sea Level Anomaly Bias : SLASVD = SLAProd – 4 mm (except for small waves) Igarss 2011 – Vancouver – Pierre THIBAUT
Impact on SWH (threshold of 84%) SWH spectrum – Ku band SWH variation MLE4 MLE4 SVD+MLE4 SVD+MLE4 10km 700m 54 cm at 20 Hz latitude 12 cm at 20 Hz Igarss 2011 – Vancouver – Pierre THIBAUT
Impact on SWH (threshold of 90 %) SWH spectrum – Ku band SWH SWH SVD SWH Prod 54 cm at 20 Hz 40 cm at 20 Hz Bias : SWHSVD = SWHProd - 3 cm (Ku) Two SWH populations appear in the SWH distribution Igarss 2011 – Vancouver – Pierre THIBAUT
Impact on residuals (threshold of 90 %) Small impact on residuals (smaller on the leading adge; higher on the trailing edge) SVD Igarss 2011 – Vancouver – Pierre THIBAUT
Performances on noise level • Synthesis of the noise levels obtained (for 90%) • Observed gains at 20 Hz are reduced at 1 Hz. • The 20 Hz denoising allows to increase the number of elementary measurements Igarss 2011 – Vancouver – Pierre THIBAUT
Applications on a track that corsses the Alghulas current (South Africa) • Jason-2 pass 96 has been processed : SVD (84%)+MLE4. SLA SWH Igarss 2011 – Vancouver – Pierre THIBAUT
Applications on a track that corsses the Alghulas current (South Africa) • Jason-2 pass 96 on 70 cycles has been processed : SVD+MLE4. SLA SVD20 Hz (84 %) SLA 20 Hz SLA 1 Hz Igarss 2011 – Vancouver – Pierre THIBAUT
Conclusions • SVD allows a strong noise reduction on SWH and range.Thisreductiondepends on the ranktruncation and canbeadapted to the application • SVD allows a gain in SLA rmsmeasurements by a factor between 1.2 • (weakwaves) to 2 (strongwaves). • SVD allows to passfrom a 7 km resolution (corresponding to 1 Hz products) to a 1.2 resolution (6 Hz) with an equivalent noise (precision of the SLA). • We are testing SVD processing on different zones wheresmall structures nowhiddenin the noise level for currentproducts, willclearlyappear. Igarss 2011 – Vancouver – Pierre THIBAUT