Assignment #2
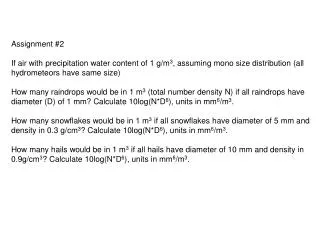
Assignment #2 If air with precipitation water content of 1 g/m 3 , assuming mono size distribution (all hydrometeors have same size) How many raindrops would be in 1 m 3 (total number density N) if all raindrops have diameter (D) of 1 mm? Calculate 10log(N*D 6 ), units in mm 6 /m 3 .

Assignment #2
E N D
Presentation Transcript
Assignment #2 If air with precipitation water content of 1 g/m3, assuming mono size distribution (all hydrometeors have same size) How many raindrops would be in 1 m3 (total number density N) if all raindrops have diameter (D) of 1 mm? Calculate 10log(N*D6), units in mm6/m3. How many snowflakes would be in 1 m3 if all snowflakes have diameter of 5 mm and density in 0.3 g/cm3? Calculate 10log(N*D6), units in mm6/m3. How many hails would be in 1 m3 if all hails have diameter of 10 mm and density in 0.9g/cm3? Calculate 10log(N*D6), units in mm6/m3.
Precipitation Content Basic units: g/m3 Simple interpretation: Mass of water in a unit volume Extreme values: 0.1 gram/m3 in light drizzle 10 gram/m3 in rain in hurricane eyewall Example: A distribution of 1000 1-mm raindrops per cubic meter would have a precipitation content of about 0.5 grams/m3.
Relationship of the Reflectivity Factor to other Meteorological Quantities Precipitation content (W): The mass of condensed water substance (water or ice) present in the form of precipitation-sized particles (detectable with radar), per unit volume. Where: Dmj is the contribution to the total mass from each raindrop j
Precipitation Rate Basic units: m3/(m2sec) = m/s Standard units: mm/hr Simple interpretation: Depth of accumulated rainfall on a runoff-free surface Extreme values: 0.1 mm/hr in light drizzle 1000 mm/hr in a hurricane eyewall Example: A distribution of 1000 1-mm raindrops per cubic meter, falling at their terminal fall speed of 4 m/s in the absence of vertical motion, would give a precipitation rate of 2.1 10-6 m/s or about 7.5 mm/hr.
Relationship of the Reflectivity Factor to other Meteorological Quantities Precipitation rate (R): The volume of precipitation passing downward through a horizontal surface, per unit area, per unit time. Where: Drj is the contribution to the rainfall rate from each raindrop j wj is the fall velocity of each drop j
What is the fall velocity of a raindrop? For drops with diameters between 0-2 mm (most drops) the fall velocity is proportional to diameter so what is the relationship to the radar reflectivity? Terminal velocity of raindrops In still air (Foote and duTroit 1969)
Problem: Illustration of inequality Consider two drops 1 mm and 2 mm Therefore: There is no exact Relationship between rainfall Rate and radar reflectivity Nevertheless, rainfall rates are qualitatively related to the radar reflectivity factor, and radar scientists have sought empirical relationships of the type: where ZR is the value of Z when R = R0
Relationship of Z to Precipitation Rate Methods of determining Z-R relationships 1. The direct method: Values of Z and R are measured by a radar and raingages. The data are compared using correlation statistics and a Z-R relationship is determined from a best fit.
Relationship of Z to Precipitation Rate Methods of determining Z-R relationships 2. The indirect method: Values of Z and R are calculated from the same measured raindrop size distribution. Methods to measure raindrop size distributions Mechanical: stained filter paper: Uses water stains in filter paper to estimate raindrop sizes (used originally by Marshall and Palmer) Impact disdrometer: Uses raindrop’s momentum when striking surface to estimate its size.
Ground Based Optical disdrometers Airborne Optical disdrometers Determine drop sizes by shadows recorded on optical arrays Foil impactors: determine drop sizes from impact craters Foil impactors
Example of raindrop images collected with an airborne optical array spectrometer in a shower in Hawaii with the largest raindrop ever recorded in nature (courtesy Ken Beard)
Measurement Issues The measurement used to arrive at a Z-R is an issue too…………. Comparison of aircraft 2D-P measurements (truncated and untruncated) to disdrometer (Joss-Waldvogel) measurement. Truncated (at 1 mm) 2D-P measurement is closer to disdrometer measurement…..small drops? DSD instrumentation is an issue (e.g., impact-type disdrometers have sensitivity problems at the small drop end of the spectrum e.g., drops < 1 mm diameter).
To estimate Z and R, exponential approximations to raindrop size distributions are often developed The Marshall-Palmer Distribution Developed from raindrop samples collected in Canada on powdered sugar filter paper in 1948 by radar pioneers Marshall and Palmer
The Marshall-Palmer Distribution The Marshall-Palmer distribution stood as the standard for many decades although many subsequent studies showed that it was not universally applicable. The exponential distribution has properties that make it useful because it is easy to relate the drop size distribution to rainfall rate, precipitation content, and radar reflectivity
Radar scientists have tried to determine Z-R relationships because of the potential usefulness of radar determined rainfall for FLASH FLOOD NOWCASTING WATER MANAGEMENT AGRICULTURE (irrigation needs/drought impacts)
Z-R Variability: Convective/Stratiform Z=a1Rb1 Z=a2Rb2 Convective 10 log10 Z Stratiform N(D) D0strat > D0conv R D
There have been hundreds of Z-R relationships published – here are just a few between 1947 and 1960 – there have been 4 more decades of new Z-R relationships to add to this table since!
Z-R relationships are dependent on the type of rainfall (convective, stratiform, mixed), the season (summer, winter), the location (tropics, continental, oceanic, mid-latitudes), cloud type etc. For the NEXRAD radars , the NWS currently uses five different Z-R relationships and can switch between these depending upon the type of weather event expected. · Default WSR-88D (Z= 300R1.4) · Rosenfeld tropical (Z=250R1.2) · Marshall/Palmer (Z=200R1.6) · East Cool Season (Z=200R2.0) · West Cool Season (Z=75R2.0)
The single largest problem in applying Z-R relationships has been accounting for effects of the radar bright band The bright band: The melting level, where large snowflakes become water coated, but have not yet collapsed into small raindrops. Wet snowflakes scatter energy very effectively back to the radar
The bright band appears as a ring on PPI displays where the radar beam crosses the melting level
SNOW Few attempts have been made to develop Z-S relationships • Snow density varies significantly from storm to storm and • within storms • Scattering by ice is non-Rayleigh (not spheres) and so the relationship between mass and Z is even less certain • Radars calibrated for rain (Z determined from K for rain, not ice, even in winter)
Measurements have been made of the size distributions of snowflakes and related to precipitation rates (melted equivalent), and Z-S relationships have been proposed but these relationships have largely been ignored in practice
Hail Very few attempts have been made to quantity hailfall from thunderstorms. Most work focuses on trying to identify whether hail is reaching the surface. This work is now focused on studies using polarization radar technology, which we will examine later in the course.
Doppler Radar From Josh Wurman NCAR S-POL DOPPLER RADAR
Doppler Shift: A frequency shift that occurs in electromagnetic waves due to the motion of scatterers toward or away from the observer. Analogy: The Doppler shift for sound waves is the frequency shift that occurs as race cars approach and then recede from a stationary observer Doppler radar: A radar that can determine the frequency shift through measurement of the phase change that occurs in electromagnetic waves during a series of pulses.
Sign conventions The Doppler frequency is negative (lower frequency, red shift) for objects receding from the radar The Doppler frequency is positive (higher frequency, blue shift) for objects approaching the radar These “color” shift conventions are typically also used on radar displays of Doppler velocity Red: Receding from radar Blue: Toward radar
Note that Doppler radars are only sensitive to the radial motion of objects Air motion is a three dimensional vector: A Doppler radar can only measure one of these three components – the motion along the beam toward or away from the radar
PROBLEM More than one Doppler frequency (radial velocity) will always exist that can fit a finite sample of phase values. The radial velocity determined from the sampled phase values is not unique
EXAMPLE VALUES OF THE MAXIMUM UNAMBIGUOUS DOPPLER VELOCITY Wavelength Radar PRF (s-1) cm 200 500 1000 2000 3 1.5 3.75 7.5 15 5 2.5 6.25 12.5 25 10 5.0 12.5 25.0 50 Table shows that Doppler radars capable of measuring a large range of velocities unambiguously have long wavelength and operate at high PRF
Folded velocities in an RHI Velocities after unfolding http://apollo.lsc.vsc.edu/classes/remote/graphics/airborne_radar_images/newcastle_folded.gif
Ways to circumvent the ambiguity dilema 1. “Bursts” of pulses at alternating low and high pulse repetition frequencies Measure reflectivity Measure velocity Low PRF used to measure to long range, high PRF to measure velocity
A Guide to interpreting Doppler Velocity Patterns Assignment #3 Rodger A. Brown and Vincent T. Wood National Severe Storms Laboratory NOAA
When more than one radar views the same region of a storm, the pulse volumes have a different orientation, gain function relative to the particles and are generally not simultaneous….. Glen Romine
How Quad Doppler wind retrieval from airborne radars works fore radar scan SQUALL LINE reflectivity shaded aft radar scan
How Quad Doppler wind retrieval from airborne radars works SQUALL LINE reflectivity shaded
How Quad Doppler wind retrieval from airborne radars works SQUALL LINE reflectivity shaded
ground previously leveled Raw unedited data
Wind Output@3.5 km cross-section to be shown later NOAA P-3 track NRL P-3 track
Vertical cross-section A A’ A A’
Some real cases during SALLJEX field campaign are available at: http://trmm.chpc.utah.edu/old_web/salljex/