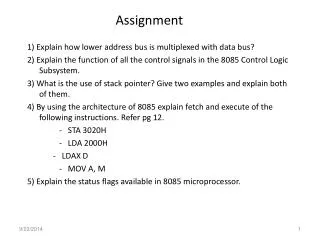
Assignment
Assignment. Read course PowerPoint file: MBD 2 Proj1.pptx (Slides 35-63). Demand. Demand represents price The “ x -axis” will be a “ q -axis” representing quantity The “ y -axis” will be a “ D ( q )-axis” representing price. Demand. Formulas given in two ways: - Stated explicitly


Assignment
E N D
Presentation Transcript
Assignment • Read course PowerPoint file: MBD 2 Proj1.pptx (Slides 35-63)
Demand • Demand represents price • The “x-axis” will be a “q-axis” representing quantity • The “y-axis” will be a “D(q)-axis” representing price
Demand • Formulas given in two ways: - Stated explicitly - Found using trend lines
Demand • Typical Graph: (note intercepts, note no negatives)
Demand • q-intercept: max quantity (price is $0) • D(q)-intercept: max price (quantity is 0 units)
Demand • Questions to consider: • How do you determine the q-intercept? • How do you determine the D(q)-intercept?
Revenue • Revenue represents total inflow of money • The “x-axis” will be a “q-axis” representing quantity • The “y-axis” will be a “R(q)-axis” representing revenue • Formula found from , never from trend lines for the project
Revenue • Typical Graph: (note intercepts and max. point, note no negatives)
Revenue • First intercept: 0 quantity gives $0 revenue • Second intercept: $0 price gives $0 revenue • Max point: maximum revenue
Revenue • Questions to consider: • How do you determine the maximum point? • What does the q-value represent? • What does the R(q)-value represent?
Cost • Cost represents total outflow of money • Total cost has 2 components: - Fixed Cost: - Variable Cost:
Cost • Fixed Cost is preproduction cost • Variable Cost is a per unit cost • Formula either given or constructed using given info
Cost • Typical Graph: (note graph always increases, note no negatives)
Cost • Note at q = 0, C(q)-intercept is above q-axis due to fixed cost
Profit • Profit represents net income • Profit is revenue minus cost
Profit • Typical Graph: (Note intercepts and maximum, note graph can be negative)
Profit • Intercepts: Break-even points ($0 profit) • Max. point: Maximum profit • Profit can be negative
Revenue • Questions to consider: • How do you determine the maximum point? • What does the q-value represent? • What does the P(q)-value represent? • How do you determine the q-intercepts?
Demand, Revenue, Cost, & Profit • Ex.Suppose the following data represents the total pairs of shoes sold in a month at a particular price in dollars. Use a second degree polynomial trend line to find an approximate model for the demand function
Demand, Revenue, Cost, & Profit • Generating graph of revenue • Use “Plotting Points” method • Use interval [0, q] where q is the q-intercept from Demand graph
Demand, Revenue, Cost, & Profit • Optimal quantity to maximize revenue is about 800 units. • Maximum Revenue is about $36,000 • Price should be about $45
Demand, Revenue, Cost, & Profit • Ex. If the fixed cost is $2000 and the variable cost is $35 per unit, determine a formula for total cost and graph C(q). • C(q) = 2000 + 35q
Demand, Revenue, Cost, & Profit • Use the graphs of revenue and cost to determine the approximate quantities where profit is zero. • Use the graphs of revenue and cost to determine the approximate quantity where profit is maximized. • What is the maximum profit?
Demand, Revenue, Cost, & Profit • Graph of Revenue and Cost (determine profit)
Demand, Revenue, Cost, & Profit • Quantities where profit is zero: 50 units and 925 units • Quantity where profit is maximized: 500 units • Maximum profit: $11,000
Demand, Revenue, Cost, & Profit • Profit function: P(q) = R(q) - C(q)
Demand, Revenue, Cost, & Profit • Use the graph of profit to determine the approximate quantities where profit is zero. • Use the graphs of profit to determine the approximate quantity where profit is maximized. • What is the maximum profit?
Demand, Revenue, Cost, & Profit • Quantities where profit is zero: 50 units and 925 units • Quantity where profit is maximized: 500 units • Maximum profit: $11,000
Demand, Revenue, Cost, & Profit • Project(Demand)
Demand, Revenue, Cost, & Profit • Project(Demand) • Determine the projected national sales
Demand, Revenue, Cost, & Profit • Project(Demand)
Demand, Revenue, Cost, & Profit • Project - Determine quadratic demand trend line (8 decimal places)
Demand, Revenue, Cost, & Profit • Project
Demand, Revenue, Cost, & Profit • Project • q-intercept found by setting D(q) = 0 and solving by using the quadratic formula • D(q)-intercept found by setting q = 0
Demand, Revenue, Cost, & Profit • Project • q-intercept is about (2480.767, 0) • This means that the maximum number of units that could be produced and sold (for $0) are 2,480,767 • D(q)-intercept is about (0, 414.53) • This means that the maximum price that could be set (selling 0 units) is $414.53
Demand, Revenue, Cost, & Profit • Project - Keep units straight - Prices (dollars) - Revenue (millions of dollars) - Quantities in test markets (whole units) - Quantities in national market (thousands of units)
Demand, Revenue, Cost, & Profit • Project (Revenue) - Units should be millions of dollars - Typically - Must adjust for units
Demand, Revenue, Cost, & Profit • Project (Revenue) Must convert revenue to millions of dollars ***Use this formula
Demand, Revenue, Cost, & Profit • Project (Revenue) – use “plotting points” method
Demand, Revenue, Cost, & Profit • Project (Cost) • Ex. Calculate the total cost for 1.5 million units
Demand, Revenue, Cost, & Profit • Project (Cost) - Use COST function from Marketing Focus.xlsx - Open Marketing Focus.xlsxand your Excel file - If you do not see the “Developer tab” click the Microsoft Office button, Excel options, Popular, Show developer tab
Demand, Revenue, Cost, & Profit • Project (Cost) - Click on Developer tab, Visual Basic - In the side bar, select VBAProjects(Marketing Focus.xlsx)
Demand, Revenue, Cost, & Profit • Project (Cost) - Locate Module 1 under VBAProject (Marketing Focus.xlsx) - Drag Module 1 into your Excel file - Close Visual Basic file
Demand, Revenue, Cost, & Profit • Project (Cost) 7 parameters for COST function quantity fixed cost batch size 1 batch size 2 marginal cost 1 marginal cost 2 marginal cost 3
Demand, Revenue, Cost, & Profit • Project (Revenue and Cost) - Graph both R(q) and C(q) - Use “plotting points” method - COST function: Insert/Function/User Defined
Demand, Revenue, Cost, & Profit • Project (Revenue and Cost)
Demand, Revenue, Cost, & Profit • Project (Profit – note the two “peaks”)