ASMFC Bluefish FMP
170 likes | 321 Vues
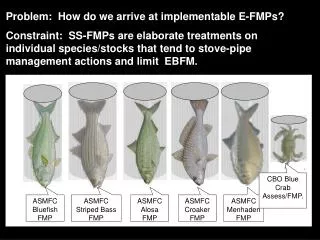
CBO Blue Crab Assess/FMP. ASMFC Bluefish FMP. ASMFC Striped Bass FMP. ASMFC Alosa FMP. ASMFC Croaker FMP. ASMFC Menhaden FMP. Problem: How do we arrive at implementable E-FMPs?

ASMFC Bluefish FMP
E N D
Presentation Transcript
CBO Blue Crab Assess/FMP. ASMFC Bluefish FMP ASMFC Striped Bass FMP ASMFC Alosa FMP ASMFC Croaker FMP ASMFC Menhaden FMP Problem: How do we arrive at implementable E-FMPs? Constraint: SS-FMPs are elaborate treatments on individual species/stocks that tend to stove-pipe management actions and limit EBFM.
FMP-Structured Management Stock Structure/ Regional concerns Stock Monitoring Stock Assessment/ Reference Points Fisheries/ Management Life History/ Demographics Habitat/Diets/ EFH~HOPCs Ecosystem considerations EIS
Common Assessment Framework across Species • Biological/Management Reference Points • aka Harvest Objectives - 10% SPR; historical abundance level • Trivial (snakeheads bad) to complex (multi-axis reference points) • Stakeholder buy-in • Stock Assessment (e.g., crab dredge survey; estimates of exploitation and abundance) • Control Rules • (Decision Support) • Thresholds ~ limits • Targets ~ optima
Challenges/Opportunities: • Preserve single species stock assessments as best available science. • Develop decision support tools related to • Species Interactions • Habitat Dependencies • Externalities (Disease, Climate, Migration, Catastrophes, Science articles) • Build integrative structures (modules) between EB-FMPs that promote EBM by developing common source material and decision frameworks. • Source Modules • Assessment Modules
Module Approach Spp Interactions Habitat Source Info Harvest
Source Modules: Reduce redundancy, improve integration. • Guild-specific Information • ASMFC – Habitat Requirements of Anadromous Fishes (under review) • Alaska Fisheries Center – Groundfish FMP • NE Center – GIS Maps of multi-spp. habitats. • Habitats of Particular Concern • SAV-maps, goals, links to fisheries productivity • Oyster Reefs • Littoral Zone • Assessment Modules: Lead to control rules, management actions • Changes in harvest policy • Changes in habitat policy (more creative thought needed here – mitigation, restoration, fishery reimbursements)
Assessment 100 Percent of Time 90 CFD Curve 80 70 Biological Reference Points Area of Criteria Exceedence 60 50 Area of Allowable Criteria Exceedence 40 30 20 10 Habitat Control Rules 0 0 10 20 30 40 50 60 70 80 90 100 Percent of Space Habitat Assessment Module: Water Quality and Designated Use Areas (EPA CBP) Migratory Finfish Spawning & Nursery Hab. EPA Chesapeake Bay Program Open water & Spawning/Nursery Habitat Criteria 5.0 Protection Against Growth Effects Protection Against Recruitment Effects 4.5 Lethal Effects (with sturgeon @29 C) 4.0 D.O. (mg/L) 3.5 Lethal Effects (with sturgeon) 3.0 2.5 Lethal Effects (w/o sturgeon) 2.0 0 10 20 30 40 50 60 70 Time (days)
Translating Water Quality Control Rules to Living Resource Currency How far are we out of compliance? What are consequences and costs?
DISSOLVED OXYGEN ACTIVE METABOLISM AEROBIC SCOPE GROWTH STANDARD METABOLISM - DO INTAKE = TEMPERATURE OSMOREGULATORY COST SALINITY SPECIFIC GILL SURFACE AREA ANABOLIC DEMAND OF OXYGEN - = ENERGY INTAKE EGESTION TEMPERATURE Bioenergetics model incorporating oxygen as limitingfactorNiklitschek and Secor (2005); adapted from Van Dam and Pauly (1995)
Distribution assumptions • Environmental • Factors • Temperature • Salinity • D. Oxygen j = - G Z Sturgeon Bioenergetics Model Potential Production
Average bottom water quality conditions in the Chesapeake Bay, July ‘90-’99 Temperature Salinity DO saturation
Summertime sturgeon habitat volumes: average conditions, ’90-’99
Release Year Sturgeon Report Card
Translating Water Quality Control Rules to Living Resource Currency – Geographic targeting Open water & Spawning/Nursery Habitat Criteria 5.0 Protection Against Growth Effects Protection Against Recruitment Effects 4.5 Lethal Effects (with sturgeon @29 C) 4.0 D.O. (mg/L) 3.5 Lethal Effects (with sturgeon) 3.0 2.5 Lethal Effects (w/o sturgeon) 2.0 0 10 20 30 40 50 60 70 Time (days)
Meeting the Chesapeake Bay Program New DO Criteria - July Target Areas Average year DO criteria met
Climate Trumps! Warming up the Bay by 1ºC - July Average year Average year plus 1ºC
Recommendations for EB-FMP development under Chesapeake 2000. • STAC, CBO, MDSG, etc. Convene managers and other stakeholders to review and accept science-management framework for EB-FMP: • Reference Point Assessment Control Rule. • 2. Scientists. Innovate biological reference points, assessments, and decision support tools for Species Interactions, Habitat Dependencies, and Externalities. Continue developing single species exploitation assessments for Bay species. • Plan Writers. Develop integrated source documents, Use Habitat modelsand GIS maps to target geographic areas for assessment and control rules, relational databases related to descriptive elements of EB-FMPs. • Funding/Research Priorities (CBO, MDSG, DNR, VMRC, ASMFC). • Dedicated support for EB-FMP assessment activities. • Emphasis on science and assumptions related to carrying capacity (habitat), migration (removals), species interactions (forage spp). • Ecosystem Modeling/Indicators/Decision tools.