Download
1 / 1
20 likes | 156 Vues
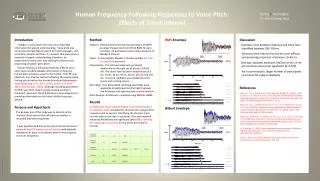
Ximing Li, Fuh-Cherng Jeng School of Hearing, Speech and Language Sciences, Ohio University, Athens, Ohio, USA. C. B. Effects of Broadband Noise on Frequency-Following Response to Voice Pitch. INTRODUCTION. RESULTS.

E N D
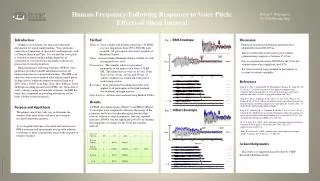
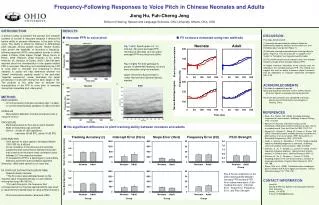
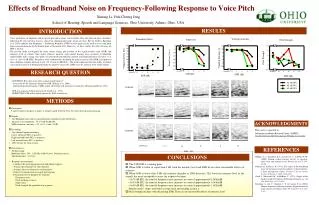
Ximing Li, Fuh-Cherng Jeng School of Hearing, Speech and Language Sciences, Ohio University, Athens, Ohio, USA C B Effects of Broadband Noise on Frequency-Following Response to Voice Pitch INTRODUCTION RESULTS Voice pitch plays an important role in speech perception. Since conversations often take place in noisy situations, following the voice pitch in noise is critical for communication and social activities. Recent studies ( Krishnan et.al, 2004) indicate that Frequency – Following Response (FFR) to voice pitch can be used to assess the pitch processing mechanisms of the human brain at brainstem level. However, in these studies the effect of noise on FFR is unclear. The present study investigated the noise effects taking into account of the signal-to-noise ratio (SNR) and intensity level of stimuli. Nine native Chinese speakers with normal hearing were recruited. A Mandarin monosyllable with a rising voice pitch was presented with different amount of background noise (no noise, +12, +6, 0,-6, and -12 dB SNR). Responses were evaluated by calculating the pitch accuracy of the FFR in response to three different stimulus intensity levels (70, 55 and 40 dB SPL). The results indicated that the ability to follow voice pitch in noise was determined jointly by signal-to-noise ratio (SNR) and the intensity level of the stimuli. RESEARCH QUESTION • QUESTION: How dose noise affect scalp-recordedresponse? • Cortical P1-N1-P2: Primarilyaffected by SNR ( Billings et al., 2009) ; • Auditory Brainstem Response ( ABR): jointly affected by both intensity level and noise (Burkard and Hecox, 1983) . • FFR also originates from brainstem level (Gardi et al., 1979). • PREDICTION: FFR will be jointly affected by SNR and intensity . METHODS A • Participants: • 9 native Chinese speakers (5 males, 4 females) aged between 20 to 30 years old with normal hearing; • Stimuli: • One Mandarin tone with a rising pitch plus continuously presented noise • Intensity level conditions: 70, 55 and 40 dB SPL • SNR conditions: no noise, +12, +6, 0, -6 and -12 dB • Recording: • One channel bipolar recording • Lower forehead (Fpz) as positive; • Right mastoid bone (M2) as negative; • Left mastoid bone (M1) as positive; • 2000 sweeps for each session • Data Analysis: • Preprocessing: • Band pass filter: 100 – 1500 Hz, 6 dB/ Octave; Baseline correct; • Threshold reject: ±25 μV; • Response measurement: • - Calculate the spectrogram for each individual response; • - Average spectrograms for each intensity • - Average time waveforms for each intensity • - Extract f0 contour from averaged spectrogram; • - Four parameters to quantify the response: • Frequency error: • Pitch tracking accuracy: • Slope error; • Pitch strength: the periodicity of response; 70 dB SPL ACKNOWLEDGMENTS REFERENCES Billings, C. J., Tremblay, K. L., Stecker, G. C., & Tolin, W. M. (2009). Human evoked cortical activity to signal-to- noise ratio and intensity level. Hearing Research, 254, 15-24. Burkard, R. & Hecox, K. (1983). The effect of the broadband noise on the human brainstem auditory evoked response. I. Rate and intensity effects. Journal of the Acoustical Society of America, 74(4), 1204-1213. Gardi, J., Merzenich, M., & McKean, C. (1979). Origins of the Scalp-recorded Frequency-Following Response in the Cat. Audiology, 18, 353-381. Krishnan, A., Xu, Y., Gandour, J. T., & Cariani, P. A. (2004). Human frequency following response: Representation of pitch contours in Chinese tones. Hearing Research, 189, 1-12. 55 dB SPL Thisstudy is supported by Advancing Academic-Research Career (AARC) Award American Speech-Language-Hearing Association 40 dB SPL A CONCLUSIONS No Noise - 12 + 12 0 - 6 +6 SNR ( dB ) • The 0 dB SNR is a turning point • When SNR is better or equal than 0 dB, both the intensity level and SNR do not show measurable effects on response • When SNR is worse than 0 dB, the response degrades as SNR decreases. The lower the intensity level of the stimuli, the more susceptible to noise the response becomes • At 70 dB SPL, the trend of frequency error increases at a rate of approximately 0.58 Hz/dB • At 55 dB SPL, the trend of frequency error increases at a rate of approximately 1.06 Hz/dB • At 40 dB SPL, the trend of frequency error increases at a rate of approximately 1.14 Hz/dB • Similar trends ( slope) are found in slope error and tracking accuracy. • Pitch strength declines with decreasing SNR. There are no measurable effects of intensity level B C