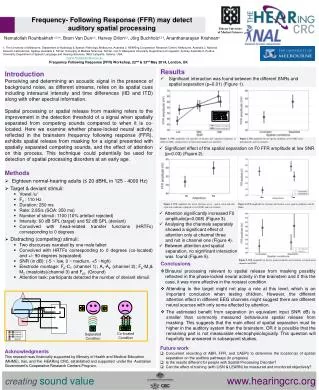
Frequency-Following Response (FFR)
Frequency-Following Response (FFR). Instructor: Fuh-Cherng Jeng. Background. Follows the periodicity (i.e., frequency content) of the stimulus. Phase locked to the periodicity of the stimulus f0 and harmonics Originates from the brainstem area. Period = 0.02 sec.

Frequency-Following Response (FFR)
E N D
Presentation Transcript
Frequency-Following Response (FFR) Instructor: Fuh-Cherng Jeng
Background • Follows the periodicity (i.e., frequency content) of the stimulus. • Phase locked to the periodicity of the stimulus f0 and harmonics • Originates from the brainstem area Period = 0.02 sec Frequency = 1/0.02 sec = 500 Hz Moushegian et al., 1973
FFR to 4 Mandarin pitch contours Tone 1 衣 Tone 2 姨 Tone 3 椅 Tone 4 意
Musical Training Enhanced FFR • Top, FFR waveforms from a musician (left) and nonmusician (right) elicited by a dipping pitch contour (Tone 3). • Middle, trajectories (yellow line) of brainstem pitch tracking elicited by the same tone from the same subjects. The black line indicates the stimulus (expected) f0 contour. • Bottom, autocorrelograms of the FFR waveforms. Color indicates the degree of correlation, with lighter colors indicating higher correlations. For the musician (left panel), the light band of color closely follows the inverse of the pitch contour of Tone 3. • Wong, Skoe, Russo, Dees & Kraus 2007 • Nature Neuroscience
Project 1: Neonates Goals and Hypotheses • Goals • Investigate the characteristics of FFR to voice pitch in neonates (1-3 days old). • Examine the relative contributions of the “biological capacity” versus “linguistic experience” influences on pitch processing at the human brainstem. • Hypotheses • Based on the “biological capacity” model, neonates will demonstrate accurate processing of voice pitch during the first few days after birth. • Based on the “linguistic experience” model, enhancement of the FFR to voice pitch will be expected as a result of exposure to a specific language environment.
Project 1: NeonatesFrequency Error Frequency Error
Project 1: NeonatesSlope Error Slope Error is the difference of the slope estimates between the stimulus and response f0 contours Slope of stimulus f0 contour Slope of response f0 contour
Project 1: NeonatesTracking Accuracy Tracking Accuracy is the regression r value between the stimulus and response f0 contours
Project 1: NeonatesPitch Strength Pitch Strength is the peak-to-trough amplitude in the normalized autocorrelation output
Project 1: NeonatesRaw data Stimulus Response Control
Project 1: Neonates Cross-linguistic comparison -Jeng et al., Ear and Hearing, 2011a
Project 2: InfantsRaw data Stimulus Response Control
Project 2: InfantsDevelopmental trend -Jeng et al., Perceptual and Motor Skills, 2010
Project 3: AutomationCan we make the procedures automated? Stimulus Response Control
Project 3: AutomationResponse threshold Response threshold Distribution of recordings obtained in experimental condition Distribution of recordings obtained in control condition
Project 3: AutomationTwo algorithms across four tones Short-Term Autocorrelation Narrow-Band Spectrogram
Project 3: AutomationReceiver operating characteristics (ROC) -Jeng et al., International Journal of Audiology, 2011b
Project 4: ModelingExponential model Time constant () Number of sweeps
Project 4: ModelingFFR trends Number of sweeps Number of sweeps
Project 4: ModelingFour indices at three stimulus intensities
Project 4: ModelingTime constant () = number of sweeps needed -Jeng et al., International Journal of Audiology, 2011c
Project 5: NoiseNoise tolerance at about 0-6 dB SNR -Li & Jeng, JASA EL, 2011d
Project 6: f0-HarmonicsRelative contributions of the f0 and its harmonics?
Project 7: f0-Harmonics Group comparison -Jeng et al., International Journal of Audiology, 2011e
Future directions • Continue, expand and better define the FFR to voice pitch in normal and pathological populations • Cross-linguistic comparison, longitudinal follow-up • Automation and modeling of the FFR to voice pitch in neonates and infants • Integration with behavioral responses • Establishment of an animal model
Spectral versus Envelope FFR • Is the FFR we recorded following the spectral components of the stimulus or its envelope?
Top left panels (A,B) show two periods of a 200 Hz tone, in opposite polarities. Top right panels (G,H) show a 2 kHz tone, amplitude modulated at 200 Hz, also in opposite polarities. The four centre panels show the expected scalp-recorded FFR for either the 200-Hz tone (C,D) or the 200 Hz envelope (I, J). Nerve fibers are unable to lock to the 2000 Hz carrier of the AM tone but can lock to its 200 Hz envelope, so the right column deals with only envelope FFRs. The average response to stimuli presented in a single polarity (+ +) contains both spectral and envelope FFRs and there are responses in both left and right columns (C, I). However, when spectral FFRs to opposite polarities (C,D) are added (+), the result (E) is small and twice the frequency of the actual responses. Conversely, when spectral FFRs to opposite polarities are subtracted (), the result (F) resembles the original spectral component in the stimulus (A). Aiken & Picton, 2008
Spectral versus Envelope FFR Aiken & Picton, 2008