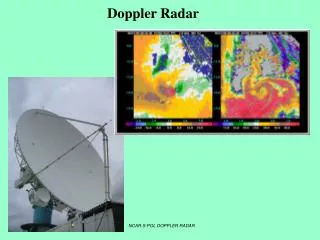
Doppler Radar
Doppler Radar. Who Invented Doppler Radar?. It was invented by Christian Johann Doppler, a physicist from Austria, in 1842. He studied at Vienna, where he became a professor of physics. Doppler worked out his ideas using sound waves. Doppler Radar Stations. How Does Doppler Radar Work?.
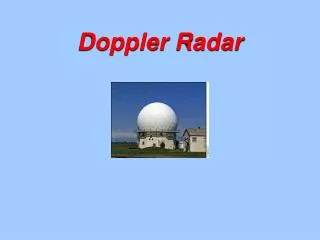

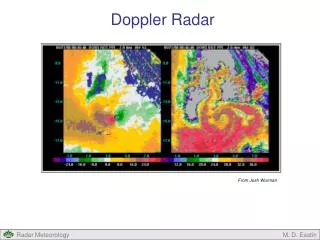
Doppler Radar
E N D
Presentation Transcript
Who Invented Doppler Radar? • It was invented by Christian JohannDoppler, a physicist from Austria, in 1842. • He studied at Vienna, where he became a professor of physics. • Doppler worked out his ideas using sound waves.
How Does Doppler Radar Work? • It obtains weather information (wind and precipitation) based upon returned energy. • Then it emits a burst of energy. If the energy strikes an object (rain drop, bug, bird, etc), the energy is scattered in all directions. A small fraction of that scattered energy is directed back toward the radar.
This reflected signal is then received by the radar during its listening period. • Computers analyze the information. (The strength, time, and phase shift of the returning pulse). • This process of emitting a signal, listening for any returned signal, then emitting the next signal, takes place very fast. • Around 1300 times each second.
Doppler radar spends the vast amount of time "listening" for returning signals it sent. • When the time of all the pulses each hour are totaled (the time the radar is actually transmitting), the radar is "on" for about 7 seconds each hour. • The remaining 59 minutes and 53 seconds are spent listening for any returned signals.
You Have Most Likely Experienced the Doppler Effect Around Trains • As the train approaches, the sound waves that make up the whistle are compressed making the pitch higher than if the train was stationary. • As the train moves away from you, the sound waves are stretched, lowering the pitch of the whistle. • As a train passes you, you may have noticed the pitch in the train's whistle changing from high to low. • The faster the train moves, the greater the change in the whistle's pitch is as it passes your location.
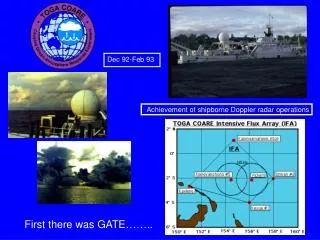
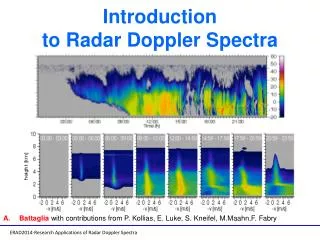
Radar Images • These are displays of echo intensity (reflectivity) measured in dBZ (decibels of Z, where Z represents the energy reflected back to the radar). • "Reflectivity" is the amount of transmitted power returned to the radar receiver.
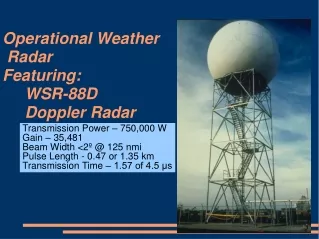
How Often Are the Images Updated? • Image updates are based upon the operation mode of the radar at the time the image is generated. The WSR-88D Doppler radar is operated in one of two modes - clear air mode or precipitation mode.
Clear and Precipitation Mode • Clear air mode- images are updated every 10 minutes. • Precipitation mode- images are updated every 5 or 6 minutes. • The collection of radar data, repeated at regular time intervals, is referred to as a volume scan.
dBZ Values • The dBZ values increase as the strength of the signal returned to the radar increases. • One scale represents dBZ values when the radar is in clear air mode. • The other scale represents dBZ values when the radar is in precipitation mode. • The scale of dBZ values is also related to the intensity of rainfall. • Typically, light rain is occurring when the dBZ value reaches 20. • The higher the dBZ, the stronger the rain rate.
What are the Different Types of Radar Images? • Base reflectivity- images are available at several different elevation angles (tilts) of the antenna and are used to detect precipitation, evaluate storm structure, locate atmospheric boundaries and determine hail potential. • Composite reflectivity-this display is of maximum echo intensity (reflectivity) from any elevation angle at every range from the radar. This product is used to reveal the highest reflectivity in all echoes.
One-hour precipitation-this is an image of estimated one-hour precipitation accumulation. This product is used to assess rainfall intensities for flash flood warnings, urban flood statements and special weather statements. • Storm total precipitation-this image is of estimated accumulated rainfall, continuously updated, since the last one-hour break in precipitation. This product is used to locate flood potential over urban or rural areas, estimate total basin runoff and to provide rainfall accumulations for the duration of the event.
What is UTC Time? • The world's weather communities use a twenty four hour clock, similar to "military" time based on the 0° longitude meridian, also known as the Greenwich meridian. • Prior to 1972, this time was called Greenwich mean time (GMT) but is now referred to as coordinated universal time or universal time coordinated (UTC). It is also known a "Z time" or "Zulu time". • To obtain your local time here in the united states, you need to subtract a certain number of hours from UTC depending on how many time zones you are away from Greenwich (England).
Why is Doppler Radar Important? • It detects severe weather events that threaten life and property. • It detects large hail, damaging winds, tornadoes, and locally heavy, flooding rain.
More importantly, this severe weather is seen by the Doppler radar more definitively than with the old conventional radar. • The severe weather is often detected minutes quicker than with the old radar, and seen in a more specific area.
Because of this, warnings can be issued for a more specific area, lessening the false alarm rate for short-lived events such as hail, damaging winds, tornadoes, and flash floods, and you have more time to take cover. • This information is beneficial to the fisherman, to aviation, and most of all to the public.