Download
1 / 56
570 likes | 941 Vues
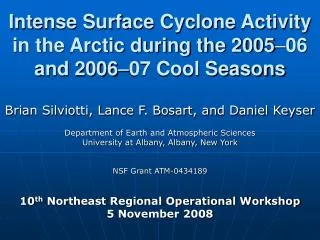
Intense Surface Cyclone Activity in the Arctic During the 2005-06 and 2006-07 Cool Seasons Brian Silviotti, Lance F. Bosart, and Daniel Keyser Department of Earth and Atmospheric Sciences University at Albany, Albany, New York 33 rd Northeastern Storm Conference 14-16 March 2008

E N D
Intense Surface Cyclone Activity in the Arctic During the 2005-06 and 2006-07 Cool Seasons Brian Silviotti, Lance F. Bosart, and Daniel Keyser Department of Earth and Atmospheric Sciences University at Albany, Albany, New York 33rd Northeastern Storm Conference 14-16 March 2008
Motivation Major Arctic Shipping Routes • Arctic not studied often • Intense arctic cyclones pose economic hazards, especially to shipping Source: www.hofstra.edu
Purpose • Establish a limited track climatology • Compare cyclone mergers and nonmergers • Present a case study of a cyclone merger event
Methodology • Definitions • Cool season – October 1 to March 31 • Arctic – poleward of 50°N • Intense cyclone – central pressure ≤ 980 hPa • Subjectively analyzed maps • Genesis/lysis time • Position and track • Central pressure • Merging
Data • Maps • NH MSLP and 1000-500 hPa thickness • NH dynamic tropopause (DT) potential temperature and wind • Datasets • GFS 0.5/1.0° analysis • NCEP/NCAR Reanalysis • Sources • Ron McTaggart-Cowan online GFS animation builder • University at Albany DEAS archive room • CDC interactive plotting and analysis web page
2005-06 Cool Season 300 hPa Height Mean and Anomaly CI = 100m CI = 10m Source: www.esrl.noaa.gov/psd
2006-07 Cool Season 300 hPa Height Mean and Anomaly CI = 100m CI = 10m Source: www.esrl.noaa.gov/psd
2005-06 Cool Season Storm Tracks Oct/Nov Dec/Jan Feb/Mar • 50 Storms • Oct/Nov: 20 • Dec/Jan: 21 • Feb/Mar: 9
2006-07 Cool Season Storm Tracks Oct/Nov Dec/Jan Feb/Mar Case Study • 96 Storms • Oct/Nov: 25 • Dec/Jan: 47 • Feb/Mar: 24
Merger Locations - By Month (2005-07) Oct/Nov Dec/Jan Feb/Mar Case Study • 44 Mergers • Oct/Nov: 11 • Dec/Jan: 22 • Feb/Mar: 11 Arctic/Arctic Mergers 23 Arctic/Mid-latitude Mergers 21
Merger Locations – By Strength (2005-07) 970 – 980 hPa 960 – 969 hPa 950 – 959 hPa < 950 hPa Case Study • 44 Mergers • 970-980 hPa: 16 • 960-969 hPa: 17 • 950-959 hPa: 9 • < 950 hPa : 2
Case Study • Example of a cyclone merger event • Occurred in Central Pacific for 11 Feb. 2007 - 19 Feb. 2007 • Two surface cyclones and three positive potential vorticity (PV) anomalies merged
300 hPa Height Mean and Anomaly for 11 Feb. 2007 - 19 Feb. 2007 CI = 50m CI = 15m Source: www.esrl.noaa.gov/psd
Case Study – Surface Lows Feb. 2007
Case Study – PV Anomalies Feb. 2007
15 Feb. 2007 12 UTC Sounding from Akita, Japan Source: www.weather.uwyo.edu