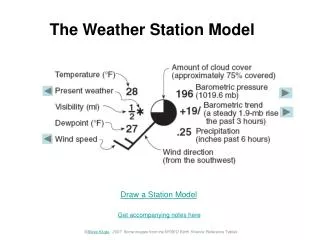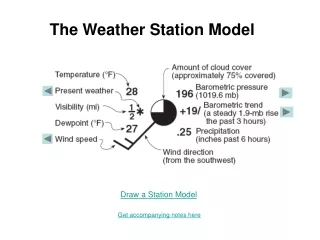

The Surface Station Model
E N D
Presentation Transcript
1. The Surface Station Model
3. Sample Surface Station Model
4. Complete Surface Station Model
5. Typical Surface Station Model Based on METAR Data
6. Sky Cover Symbols
7. Wind Speed and Direction Wind speed and wind direction are plotted using a wind arrow.
The wind direction is plotted with the wind arrow indicating the direction of the wind blowing into the station circle.
8. Wind Speed Wind Speed is indicated by the number of half barbs, whole barbs, and flags.
The wind speed is indicated by the sum of the wind speeds represent by the half barbs, whole barbs and flags.
9. Wind Speed
10. Wind Speed
11. Wind Speed (cont.)
12. Wind Speed (cont.)
13. Wind Speed (cont.)
14. Wind Speed (cont.)
15. Three Hour Pressure Change Characteristic
16. Low Cloud Symbols
17. Middle Cloud Symbols
18. High Cloud Symbols
19. Present Weather Symbols
20. Online Symbols A good source of information about the symbols used in the surface station model is
http://www.shr.noaa.gov/jetstream/synoptic/wxmaps.htm
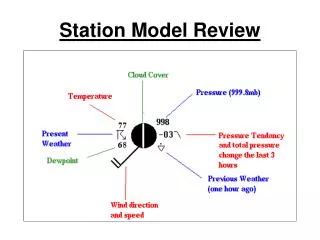
21. Sample Surface Station Model
22. Decode and Plot the Following METAR Report KOKC 301152Z 10006KT 6 SM �TSRA BR SCT033CB OVC110 13/11 A3028 RMK AO2 TSB1059RAB1059 PRESRR SLP251 OCNK LTGICCA NE TS OVHD MOV E P0010 60010 70029 T01280111 10144 20128 53022