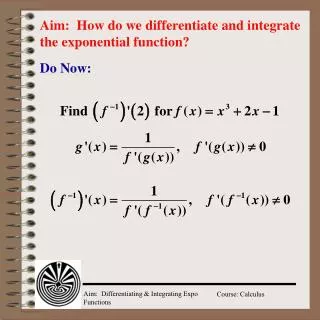
Aim: What is the exponential function?
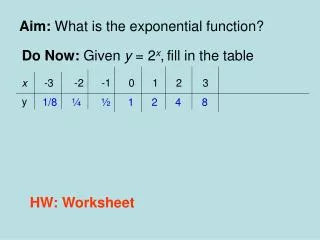
Aim: What is the exponential function?. Do Now: Given y = 2 x , fill in the table. x -3 -2 -1 0 1 2 3 1/8 ¼ ½ 1 2 4 8. y. HW: Worksheet. y = 2 x. y = 4 x. y. y = 3 x. y = 2 x. x. Exponential Functions. What about y=(1/2) x ?.

Aim: What is the exponential function?
E N D
Presentation Transcript
Aim: What is the exponential function? Do Now: Given y = 2x,fill in the table x-3 -2 -1 0 1 2 3 1/8¼ ½1248 y HW: Worksheet
y = 4x y y = 3x y = 2x x Exponential Functions What about y=(1/2)x ? Graph the curves y = 2x, y = 3x, y = 4x on the same coordinate system y=(1/2)x 1
All base exponential functions are similar because they all go through the point (0,1), regardless of the size of their base number Exponential Functions are written in the form: f(x) = abx a = constant b = base x = variable
Properties of the basicf(x) = abx function • The domain consist of all real numbers x • The range consists of all positive all real numbers y • The function is increasing when b >1 and decreasing when 0 < b < 1 • It is one to one function • The x –axis is the horizontal asymptote to curve, toward the left when b>0 and toward the right for 0 < b <1
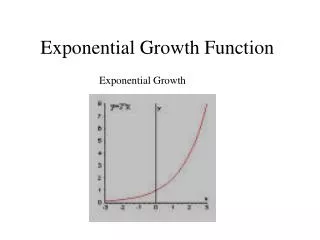
Exponential Function: Any equation in the formf(x) = Cbx. if 0 < b < 1 , the graph represents exponential decay – the y-value is going down as x increases if b > 1, the graph represents exponential growth – the y-value is going up as x increases Examples: f(x) = (1/2)x f(x) = 2x Exponential Decay Exponential Growth We will take a look at how these graphs “shift” according to changes in their equation...
Take a look at how the following graphs compare to the original graph of f(x) = (1/2)x : f(x) = (1/2)x f(x) = (1/2)x + 1 f(x) = (1/2)x – 3 Vertical Shift: The graphs of f(x) = Cbx + k are shifted vertically by k units.
Take a look at how the following graphs compare to the original graph of f(x) = (2)x : (0,1) (0,-1) (-2,-4) f(x) = (2)x f(x) = –(2)x f(x) = –(2)x + 2 – 3 Notice that f(0) = 1 This graph is a reflection of f(x) = (2)x . The graph is reflected over the x-axis. Shift the graph of f(x) = (2)x ,2 units to the left. Reflect the graph over the x-axis. Then, shift the graph 3 units down
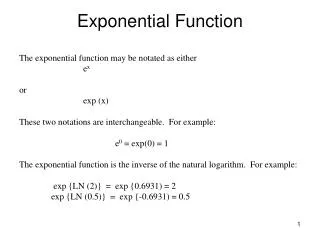
e = 2.71828…. This number is called the natural base. It is called this because the value seems to occur naturally in many situations. e is an irrational number that is similar to the property of . e is a very important in calculus since the derivative of e is itself. The function f(x) = ex is the natural exponential function.
The population of the United States can be modeled by the function p(x) = 80.12e0.131x where x is the number of decades since 1900 and p(x) is the population in millions • graph p(x) over the interval 0 x 15 • If the population of United States continues to grow at this rate, predict the population in the years 2010 and 2020.