Creating a Kinship Matrix using Microsatellite Analyzer (MSA)
340 likes | 636 Vues
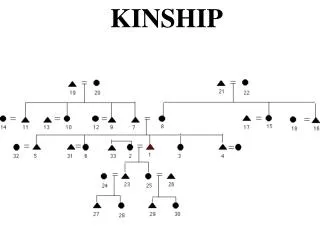
Creating a Kinship Matrix using Microsatellite Analyzer (MSA). Zhifen Zhang The Ohio State University. Why create a kinship matrix?. Visualize family relatedness Use in association mapping. The Objective of this Tutorial:

Creating a Kinship Matrix using Microsatellite Analyzer (MSA)
E N D
Presentation Transcript
Creating a Kinship Matrix using Microsatellite Analyzer (MSA) Zhifen Zhang The Ohio State University
Why create a kinship matrix? • Visualize family relatedness • Use in association mapping The Objective of this Tutorial: To introduce one approach to generate a kinship matrix for a population Using Microsatellite Analyzer (MSA)
Background Types of Populations for Association Mapping (Yu, et al. 2006): The highlighted population needs a kinship matrix for analysis.
Scheme of Mapping Germplasm Phenotyping (Y) Genotyping Genome-wide scan Background markers Genome-wide polymorphisms (G) Population structure (Q), kinship (K) Association analysis (General Mixed Model): Y=G+Q+K+e Zhu et al. 2006
Coefficient of Kinship Coefficient of kinship is used to measure relatedness DEFINITION: Coefficient of kinship is the probability that the alleles of a particular locus chosen randomly from two individuals are identical by descent (Lange, 2002) * Identical by descent: the identical alleles from two individuals arise from the same allele in an earlier generation
Kinship Matrix Calculation The kinship coefficient is the probability that an allele (a) taken randomly from population i (at a given locus) will be identical by descent to an allele taken randomly from population j at the same locus Kf= ∑k∑a (fai * faj)/D Where ∑k∑a (fai * faj)/D is the sum of all loci and all alleles; fai is the frequency of allele a in population i, fajis the frequency of allele a in population j, D is the number of loci. Cavalli-Sforza and Bodmer, 1971. MSA manual page 23
An Example In population 611R2 and 611R3, three loci were studied and summarized. Coefficient of kinship for populations 611R2 and 611R3: Kf= ∑k∑a (fai * faj)/D = (1x1+1x0 + 0x1+1x1)/3=2/3 The frequencies of alleles A in populations 611R2 and 611R3 are 1; the frequency of allele b is 1 in population 611R2 but 0 in population 611R3; the frequency of allele B is 0 in population 611R2 but 1 in population 611R3; the frequency of allele c is 1 in each population.
Kinship Matrix In the unified mixed model (Yu et al. 2006), marker-based kinship coefficient matrices are included A marker-based kinship coefficient matrix can be generated using Microsatellite Analyzer (MSA)
Pipeline for Matrix Generation Data Entry to Create a Spreadsheet Genotyping with Markers Arrange Data in a Format Recognized by MSA Run the Kinship Coefficient Analysis Import the .dat File into MSA
A Case Study Bacterial spot data provided by Dr. David Francis, The Ohio State University
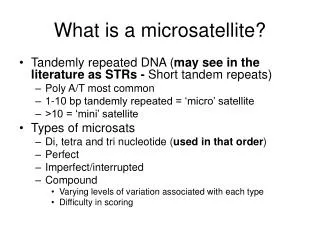
Data Preparation For genotyping, molecular markers can be: Microsatellite (Simple Sequence Repeat, SSR) SNP (Single Nucleotide Polymorphism) RFLP (Restriction Fragment Length Polymorphism) AFLP (Amplified Fragment Length Polymorphism) Other sequencing markers MSA was designed for SSR analysis For other marker types, a value is designated for each allele, e.g. For SNPs, A can be 11, C can be 12, G can be 13, and T can be 14.
Data Entry After genotyping, a spreadsheet of genotypic data can be generated as shown below. Genotype Score Marker Population Genotype Score: 0 is homozygous for allele a, 1 is homozygous for allele b, 2 is heterozygous.
Data Formatting Population # Give a new value to each allele for each marker Mating scheme Group name: default “1” These 3 cells should be empty. Row 1 can be left empty.Columns a, b, and chave to be filled. In cell A1, enter ‘1’. Row 2 is marker name. Genotype data start in row 3.
Data Formatting Two-row entry for each individual (we are treating individuals as populations) to specify heterozygotes and homozygotes Homozygotes have the same value in both rows. Heterozygotes have different values in each row.
After Formatting Save the file in a “Tab Delimited” text format, change the extension name “.txt” into “.dat”.
MSA (Microsatellite Analyzer) is available for free, provided by Daniel Dieringer.
MSA is compatible with different operation systems Choose the operating system you use and install it as other software
Install MSA For Mac, a folder for MSA will be formed after you extract the downloaded file
Use MSA Manual for MSA is available in the folder Sample data is available
Use MSA Menu of Commands Enter command “i” to import file
Use MSA Import your data file to MSA easily by dragging it to the MSA window
Use MSA After the data file is imported, Enter command “d” to access submenu of “Distance setting”
Use MSA Enter “4” to turn on kinship coefficient module.
Use MSA Each line will be treated as a population in this study Input command “c” to turn on “Pair-wise populations distances calc”
Use MSA NOTE: Dkf in the matrix will be 1-kf in default. After everything is set, input “!” command to run the analysis.
Use MSA After the analysis, a folder of results will be created automatically in the same folder as your data file
Use MSA The kinship matrix is in the folder of “Distance _data”
Use MSA The Kinship matrix is saved as a file named “KSC_Pop.txt” Open the file with Excel to read the the matrix
Number of individuals Kinship Matrix The population (line) code
Number of individuals Kinship Matrix Please remember that the value in the matrix is “1-kinship coefficient”. The population (line) code
Final Matrix Use “1-X” (X is the value of each cell in the matrix) to generate a new matrix that will be the kinship matrix in Excel.
The Mixed Model Marker effect Phenotype score Residual or Error Y= αX+ γM+ βQ + υK + e Population structure Kinship Matrix will be used in the Unified Mixed Model to explain familial relatedness Fixed Effect rather than markers Yu et al. 2006
References Cited & External Link References Cited • Cavalli-Sforza, L. L., and W. F. Bodmer. 1971. The genetics of human populations, W.H. Freeman and Company, NY. • Lange, K. 2002. Mathematical and statistical methods for genetic analysis, 2nd edition. Springer-Verlag, NY. • Yu, J. G. Pressoir, W. H. Briggs, I. V. Bi, M. Yamasaki, J. F. Doebley, M. D. McMullen, B. S. Gaut, D. M. Nielsen, J. B. Holland, S. Kresovich, and E. S. Buckler. 2006. A unified mixed-model method for association mapping that accounts for multiple levels of relatedness. Nature Genetics 38: 203-208. (Available online at: http://dx.doi.org/10.1038/ng1702) (verified 8 July 2011). • Zhu, C. M. Gore, E. S. Buckler, and J. Yu. 2008. Status and prospects of association mapping in plants. The Plant Genome 1: 5-20. (Available online at: http://dx.doi.org/10.3835/plantgenome2008.02.0089) (verified 8 July 2011). External Link • Dieringer, D. Microsatellite analyzer (MSA) [Online]. Available at: http://i122server.vu-wien.ac.at/MSA/MSA_download.html (verified 8 July 2011).