Download

1 / 41
410 likes | 568 Vues
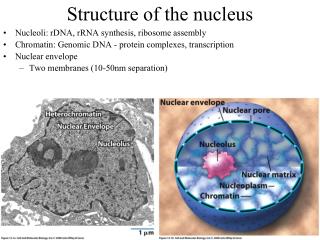
Direct and indirect measures of the permeability of the nucleus pulposus. Dr Phil Riches Bioengineering Unit. Permeability. Permeability governs the relative movement of solid and fluid within porous media.

E N D
Direct and indirect measures of the permeability of the nucleus pulposus Dr Phil Riches Bioengineering Unit
Permeability • Permeability governs the relative movement of solid and fluid within porous media. • The intervertebral disc resists high loads by creating a hydrostatic pressure through a low permeability. • The rate at which fluid flow out of the disc, fluid pressure is lost, and hence the deflation of the disc, is governed by permeability. • During periods of rest, the disc swells and the rate of fluid uptake is also governed by permeability. • Since the disc is avascular, fluid uptake is also associated with nutrient uptake.
Osmotic pressure (≈ swelling stress) • Due to the presence of negatively charged proteoglycans, the disc has a high osmotic pressure, p. • π contributes to disc swelling during rest Resistance to compressive stress by augmenting the hydrostatic pressure. convective transport of large nutrients. • Fluid flows from regions of low p to regions of high p. • p increases with compression
Altered biosynthesis with loading Iatridis et al., J.Bone Joint Surg. Am., 88, 41-46, 2006
Determining the permeability of IVD tissue • There are two ways: • Direct permeation tests • Fluid induced deformation • Indirect determination via fitting a mathematical model to experimental data • How good is the model?
Questions • Can osmotic pressure effects be seen in permeability data from indirect measurement? • Is permeability affected by the disc’s swelling pressure? • Do ramp and hold phases have different parameters? • p should augment stress relaxation and hinder loading. Apparent permeability should be increased in former. • Is the direct method any better? • Can fluid flow induced deformation be analysed?
Large strain model of confined compression • Holmes J. Biomech. Eng. 108, 372-381, 1986. • U - displacement with respect to undeformed state • Z - is undeformed axial dimension • l - is the stretch ratio (= 1 + strain) • HA0, b, s0are model parameters to be found Initial swelling stress
Permeability models, k(l) • A few different models exist, with two common ones being: • The following model is proposed: Lai et al., 1980 Holmes and Mow, 1990
TO MTS POROUS PLATENS SAMPLE Heneghan and Riches, J. Biomech., 41, 2411-2416, 2008 Experimental Methods • 24 Bovine coccygeal samples • 10mm diameter • 1130 ± 140μm thick • Samples were tested in 0.15 M, 3.0 M and 6.0M NaCl, to vary s0 • External salt solution can negate osmotic effects After 2 hours equilibrating with external salt solution, a ramp-hold 20% compression was applied at a strain rate of 2mm/s. Displacement, stress and time recorded.
Direct methodology • The models were fitted in 3 steps • Initial swelling stress, s0 • HA0 and b were fitted using equilibrium data • k0 and M were determined from time dependent data using the Nelder-Mead simplex method • Data were fitted to both loading and stress relaxation phases. Parameters compared between phases.
Data Analysis • Preliminary graphs indicated that a linear relationship existed between Ln(k0) and Ln(s0). • An ANCOVA was used to assess the effects of Ln(s0), loading/stress relaxation and model on Ln(k0) and M. • The statistical model explained 80% of the variation in Ln(k0) and 50% of the variation in M.
Results & discussion • An increase in Ln(s0) pressure decreased Ln(k0) (p < 0.001) • Loading and stress relaxation phases resulted in different k0 and M values, and a significant interactions also existed with phase and Ln(s0) (all p < 0.001). • If the model was representative of the tissue, then these differences should not exist.
Conclusion • Before the model can be used reliably for permeability determination of IVD (and cartilage?) tissue, either • The constitutive equations for the large strain theory need to be amended to include osmotic pressure as a driving force for fluid flow, or • A triphasic large strain theory needs to be developed (the third phase being the negative ion phase)
Heneghan & Riches, J. Biomech. 41, 903-906, 2008 Direct permeabilitymeasurement Hydraulic permeability values vary from 2x10-15 m4/Ns at l = 1, to 3x10-16 m4/Ns at l = 0.35 DP = 30kPa; v≈ 0.06 m/s
Modelling direct permeation • Using the aforementioned model, we can theoretically analyse the permeation experiment • Viscous drag associated with fluid flow will deform the tissue. • Two boundary conditions exist • Solid is fixed to top platen (clamped) • Boundary of tissue is free to deform due to viscous drag (unclamped)
Modelling conclusions • The model suggests: • Localised variation in strain at equilibrium • With applied strain, tissue becomes more homogenous, but a 20% difference in k still exists at l = 0.3. • Actual k0 may be three times that measured by direct permeation due to fluid flow induced deformation
Conclusion • Theoretical modelling predicts significant fluid flow induced deformation below 20% compression. • This can be “seen” in experimental data, although inconclusively. • Osmotic effects are not readily apparent from this experiment since external salt solution was constant at 0.15M NaCl
Overall conclusion • No method currently provides a gold standard measurement of permeability • Direct method will always suffer from flow induced deformation, unless very slow pumps are used. • Models need to be developed to incorporate osmotic effects into a large strain formulation.
Acknowledgements • Paul Heneghan
Indirect methodology • Models of the disc predict high localised strain, near the boundary of load application • Material properties need to be determined to high compressive strain to validate models. • Large strain theory is required
Permeation Internal reorganisation Fluid pressure gradient Fluid flow - Osmotic pressure gradient
Ramp phase Consolidation Fluid pressure gradient Fluid flow - Osmotic pressure gradient
Hold phase Internal reorganisation Fluid pressure gradient Fluid flow - Osmotic pressure gradient
Expansion phase Internal reorganisation Fluid pressure gradient Fluid flow - Osmotic pressure gradient