Word Problems
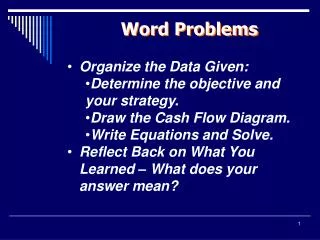
Word Problems. Organize the Data Given: Determine the objective and your strategy. Draw the Cash Flow Diagram. Write Equations and Solve. Reflect Back on What You Learned – What does your answer mean?. Reviewing…. Complex Cash Flows – Must split-up and recombine at the SAME point in time.

Word Problems
E N D
Presentation Transcript
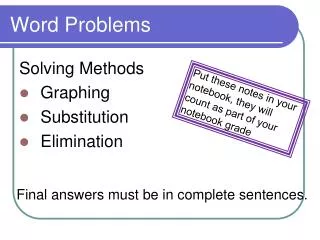
Word Problems • Organize the Data Given: • Determine the objective and your strategy. • Draw the Cash Flow Diagram. • Write Equations and Solve. • Reflect Back on What You Learned – What does your answer mean?
Reviewing… • Complex Cash Flows – Must split-up and recombine at the SAME point in time. • Linear gradient cash flows always begin at the end of year two. • Strategy – comparisons must occur at the same point in time. • Periods for i and n must match!
Present Worth Analysis Net Present Worth of initial and future cash flows can be used to select among alternative projects. It is important to understand what Net Present Worth means, especially when the cash flows include both revenue and expenses.
Present Worth Analysis • Project selection based on Present Worth Analysis: • If all expenses and revenues are included, select the largest NPW that is greater than zero. • Doing nothing is an option • (leaving the $ to earn “safe” interest) • If some or none of the revenues are included, select the largest NPW. • “Must Do situation”
Terminology Salvage Value – the amount of money you can expect to receive by selling an asset when you are done with it. What value does it have when you are done with it? MARR – Minimum Attractive Rate of Return – I expect or need this return in order to be willing to invest my money.
Example Problem Project A costs $10,000 and will last for 10 years. Annual, end of the year revenues will be $3,000, and expenses will be $1,000. There is no salvage value. Project B costs $10,000 and will also last for 10 years. Annual revenues will be $3,000 with annual expenses of $1,500. Salvage value is $5,000. Conduct an economic analysis to select the preferred project using a MARR of 10% per year, compounded annually.
DIAGRAM: NPWA ? $3 000 10 0 1 2 3 4 $1 000 $10 000 Example Problem Project A costs $10,000 and will last for 10 years. Annual, end of the year revenues will be $3,000, and expenses will be $1,000. There is no salvage value. GIVEN: LIFETIME = 10 YRS MARR = 10%/YR, CPD ANNUALLY FIRST COST = $10 000 ANNUAL REVENUES = $3 000/YR ANNUAL COSTS = $1 000/YR SALVAGE VALUE = $0 FIND NPWA: NET ANNUAL = ANNUAL REVENUES – ANNUAL COSTS = $3000/YR–$1000/YR = $2000/YR NPWA = A(P|A,i,n) – 1ST COST = $2 000(P|A,10%,10)–$10 000 = $2 000(6.1446)–$10 000 = $2 289
DIAGRAM: NPWB ? $5 000 $3 000 10 0 1 2 3 4 $1 500 $10 000 Example Problem Project B costs $10,000 and will also last for 10 years. Annual revenues will be $3,000 with annual expenses of $1,500. Salvage value is $5,000. GIVEN: LIFETIME = 10 YRS MARR = 10%/YR, CPD ANNUALLY FIRST COST = $10 000 ANNUAL REVENUES = $3 000/YR ANNUAL COSTS = $1 500/YR SALVAGE VALUE = $5 000 FIND NPWB: NET ANNUAL = ANNUAL REVENUES – ANNUAL COSTS = $3 000/YR–$1 500/YR = $1 500/YR NPWB = A(P|A,i,n) + SALVAGE(P|F,i,n) – 1ST COST = $1 500(P|A,10%,10)+ $5 000(P|F,10%,10)–$10 000 = $1 500(6.1446) + $5 000(0.3855)–$10 000 = $1 144 ►PREFER A
What does this mean? NPWA = $2 289 NPWB = $1 144 We prefer project A over project B. Does NOT mean a $2 289 profit! Concept: We favor Project A by $2 289 over taking $10 000 and putting it in an account earning 10%.
In other words… • With expenses and revenues known, select the largest NPW > 0 • Select Project A What does this mean? At i = 10% (cpd yearly), $2 000 at the end of each of the next 10 years is worth, today, $2 289 more than the initial cost of $10 000.
Further… • You would be willing to pay as much as $10,000 + 2,289 = $12,289 for the project. • At that price and at i = 10%, you are indifferent between: • Investing $12,289 for 10 years at i = 10%. • Obtaining $2000 at the end of each of the next 10 years (and reinvesting each receipt at 10%).
Illustrating… F10 = (10,000 + 2,289) (F | P, 10%, 10) = (10,000 + 2,289) (2.594) = $31,875 F10 = 2000 (F | A, 10%, 10) = 2000 (15.937) = $31,875
Thus… The project only costs $10 000, but at i = 10% it is equivalent to investing $10 000 + $2 289 for 10 years. Since PW > 0, you are actually earning more than 10% on investment.
Present Worth Analysis • When applied correctly, NPW can be used to select among various alternative projects. • The larger the NPW the better. • Requires establishing MARR. • MARR is used as the (i) in the equations.
Plotting NPW vs. i 10 000 NPW ($) IRR 2 289 0 10% 15.1% i (%) Why does NPW decrease as i increases?