big data arcchitechture Infographic
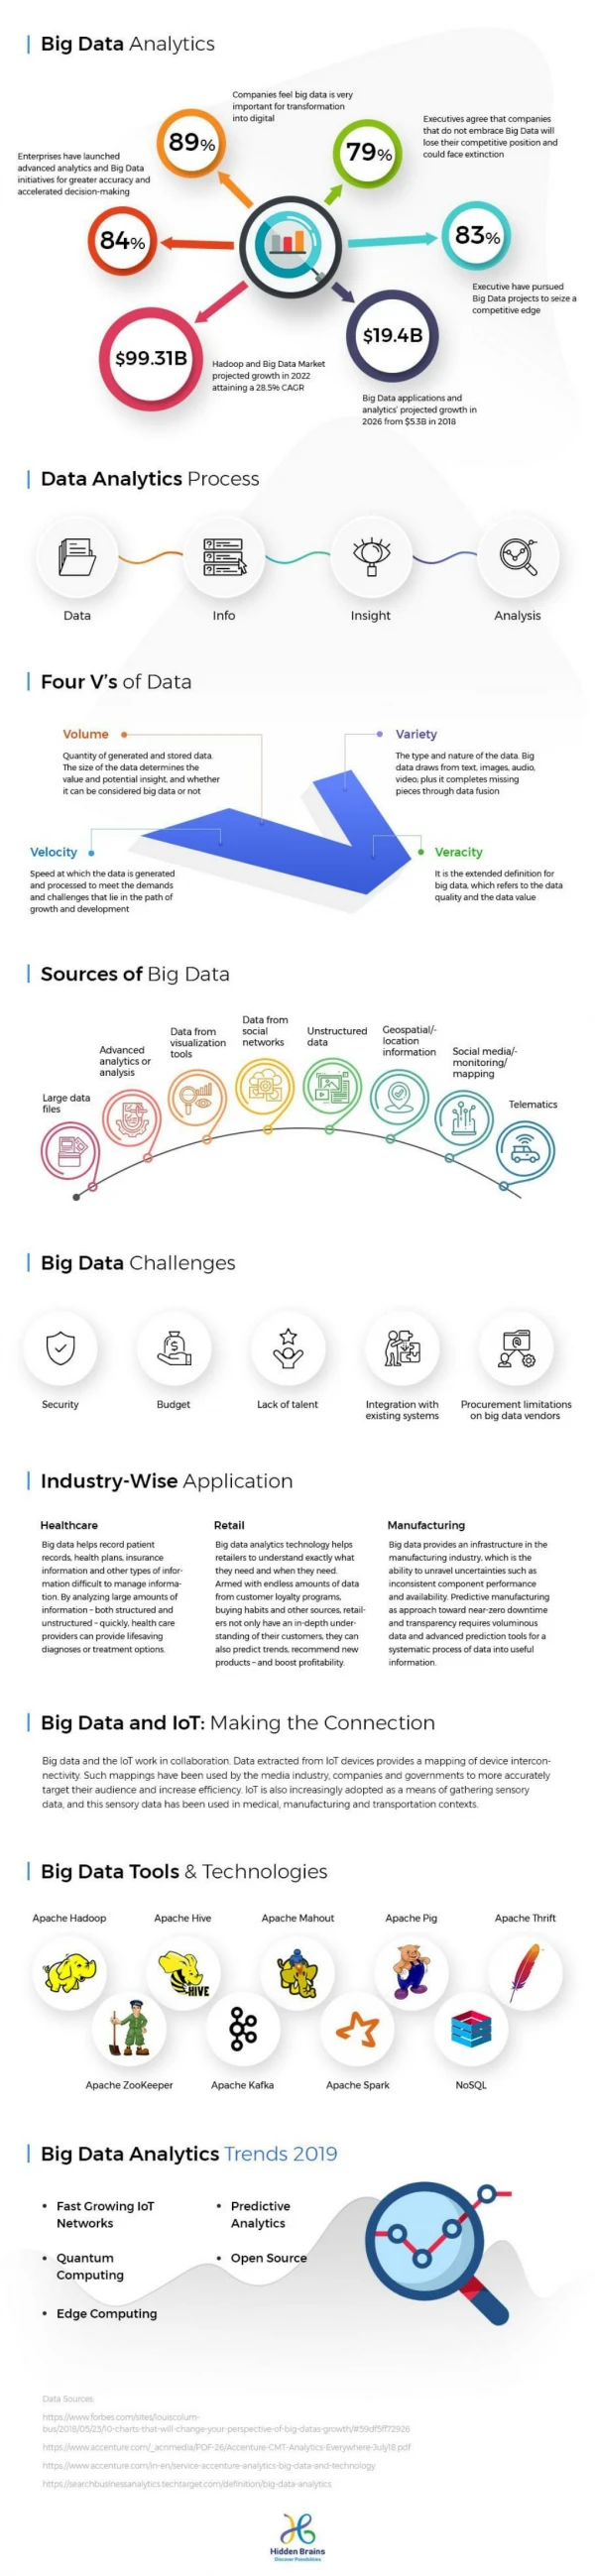
This infographic explains the end-to-end flow of modern AI-driven business intelligence systems, from data collection all the way to insights and predictive models. It outlines how raw data is gathered, processed, secured, stored, and analyzed using big data pipelines, ETL workflows, distributed systems, and AI/BI tools. The visual emphasizes the importance of data quality, security, and real-time intelligence in enabling smarter business decisions.


big data arcchitechture Infographic
E N D
Presentation Transcript
1. Data enters the system from various sources—apps, sensors, logs, APIs, and databases. Big Data pipelines collect and stream this information in real time or batches. 2. Raw and structured data is stored securely in data lakes, warehouses, or distributed systems. Enables scalable, cost-efficient storage for massive datasets. 3. Data is cleaned, transformed, and enriched using ETL/ELT workflows or distributed computing tools. Makes data usable for analytics, reporting, and machine learning. 4. AI and BI tools analyze processed data to extract insights, generate reports, and create predictive models. Supports better decisions and real- time intelligence across the business. 5. Ensures data quality, security, and privacy across the architecture. www.hdatasystems.com