Download
1 / 25
250 likes | 462 Vues
Quarterly Site Status Reports. Discussed at 2011 Steering Committee Meeting E-mailed to 47 recipients at the conclusion of each calendar quarter. Training Videos & Local Time . During maintenance off-season, we will be creating an operator training video for weekly sample changes.

E N D
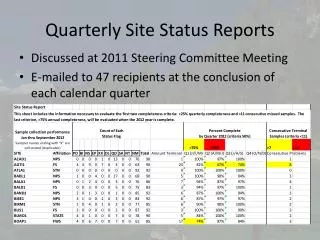
Quarterly Site Status Reports • Discussed at 2011 Steering Committee Meeting • E-mailed to 47 recipients at the conclusion of each calendar quarter
Training Videos & Local Time • During maintenance off-season, we will be creating an operator training video for weekly sample changes. • Depending on the results, we may create videos for • Flow rate audits • Pump replacement • Ebox replacement • Module replacement • Controller replacement • As of Fall 2012, we will begin sampling on Local Standard Time. In Spring 2012, we will remind operators not to change to Daylight Saving Time. • Newsletter article would be helpful
Site Safety Concerns • WHPA • SNPA
Crocker Nuclear Lab: News and Review IMPROVE Steering Committee Meeting October 2012
Data Delivery is Back on Track! • 2011 samples were all analyzed using the new PANalytical XRF systems • This change delayed data delivery • After several months of not delivering data, we delivered • Jan/Feb/Mar 2011 in June 2012 • Apr/May 2011 in July 2012 • Jun/Jul/Aug 2011 in September 2012 • Sept/Oct 2011 in October 2012 • Nov/Dec 2011 will be delivered in early November 2012 • First time in 8 years that we have delivered data within a year of sample collection! • We are poised to decrease the lag time over the next year.
UC-Davis Operational ChangesExact Slide from 2011 Meeting • 2010-2011 • New laboratory location • New Mettler balances & calibration protocols • 2011-2012 • PANalyitcal Epsilon 5 XRF instruments • New laboratory management software • New field maintenance management software • New controller hardware & software • PM10 flow rate measurement improvement • Bar coded Teflon filters • 2012-2013 • Temperature & RH control for weighing chamber • Automated weighing system • Multi-wavelength laser absorption • New data validation, processing & delivery software • New pre-cut inlets for PM2.5 cyclone cut-point irregularities • 2010-2011 • New laboratory location • New Mettler balances & calibration protocols • 2011-2012 • PANalyitcal Epsilon 5 XRF instruments • New laboratory management software • New field maintenance management software • New controller hardware & software • PM10 flow rate measurement improvement • Bar coded Teflon filters • 2012-2013 • Temperature & RH control for weighing chamber • Automated weighing system • Multi-wavelength laser absorption • New data validation, processing & delivery software • New pre-cut inlets for PM2.5 cyclone cut-point irregularities
PANalytical XRF Instruments • Operating three XRF instruments • Running 24/7 • Working on further automation of the system to avoid weekend refills • Blank corrections, detection limits, and uncertainties are now based on field blanks and collocated data • Warren will discuss in detail • New XRF data can be compared to data from prior instruments
Upside down diaphragm on 3rd instrument
Upside down diaphragm on 3rd instrument
The chloride ion measurement is a respectable predictor of conserved sea salt markers [White (2008) Atmospheric Environment 42, 261–274]. • The legacy XRF data greatly over-correct for matrix attenuation of the Na signal [above right].
More to come • The over-correction of Na creates the appearance of Cl depletion where it does not exist.
Sampler Electronics RedesignCurrent sampler electronics are 13 years old • Pressure sensors (analog devices) have been discontinued • Solution: Digital Sensors - smaller, more flexible • Electrical noise - unshielded signals, long transmission distances • Solution: Digital sensors and transmission - immune to noise and degradation • Limited display size forces cryptic messages to operators • Solution: Opportunity for larger display, improved GUI for operators • “Sneakernet” shipping of physical data cards with sampling supplies results in 3-4 week delay before problems are detected • Solution: Cellular and satellite data transmission to receive performance data in real time
Sampler Electronics Redesign Timeline • Phase I: April to November 2012 • Sensor Concept and Selection Proof of Concept • Phase II: December 2012 to March 2013 • Controller, Display, and Modem Selection and Prototype • Phase III: April to September 2013 • Final Development and Testing • Phase IV: Winter 2013/Spring 2014 • Initial Deployment to Sites
Sampler Electronics Redesign Goals and Components • Maximize reuse of existing hardware to minimize cost • Repackaging new electronics in existing ebox form-factor allows reuse of existing module hardware • Pushing data collection to modules eboxes • Digitization performed at point of measurement. • Increases flexibility for later changes to the system including possibility of controlling flow rate • Quake Global Q-4000 Modem • Fully programmable Cellular/Satellite Data Modem -selects best/cheapest available mode, sends health status and flow data back to base in real time.
Data Management • In the past, our Applications Development Group was not able to deliver solutions that worked • We have a new team of developers • Design of the workflow and database for the whole data management system is underway • The overall application design includes field operations, lab operations, and data processing and validation • Consolidate all operational data into SQL Server • Ability to track all data manipulations and processing • Avoid direct interaction between staff and databases • New architecture will allow easy integration
Matrix Coded Teflon Filters • The matrix is tiny • Presents challenges for most code readers • We received the code reader this summer and are working on getting the codes passed into a useable format.
PM2.5 Cut Point Discrepancies • Collocated data display much larger differences in soil-derived elements than expected
Presence of Large Particles on Filters • PM2.5 cut point cyclone • Light microscopy followed by TEM shows >2.5 micron particles, some approaching 20μm!
Third Vote • Added a 3rd collocated A-type module at Phoenix, for a total of 3 collocated PM2.5 modules • Observations did not suggest one module was “wrong”
Cut Point Discrepancy Tests • Leaks? • Leaks could bypass the cyclone, explaining the presence of larger particles. • Installed HEPA filter at inlet of Phoenix 4th A module • No significant mass collected on samples with HEPA filter • Rules out post-cyclone leak, filter contamination • Local Sources? • Two ‘A’ type modules sampling from a single sampling inlet • To remove possibility of local sources encountering one sampler and not another.
PM2.5 Cut Point Tests • Greased cyclone tests • Some large particles may bounce or shatter on cyclone surface and proceed to filter • Differences suggest greasing makes a difference • Pre-Cut: Testing two-cyclone system • Prototype cyclone designed for 5mm cut point at 23LPM • Fabricated on 3D printer out of cornstarch, cheap $
UC-Davis Planned Operational Changes • 2012-2013 • PANalyitcal Epsilon 5 XRF instruments • Complete automation • New field maintenance management software • New controller hardware & software • PM10 flow rate measurement improvement • Bar coded Teflon filters • Multi-wavelength laser absorption • 2013-2014 • New laboratory management software • New pre-cut inlets for PM2.5 cyclone cut-point irregularities • 2014-2015 • New data validation, processing & delivery software • Automated weighing system • Temperature & RH control for weighing chamber