Download
1 / 27
270 likes | 410 Vues
Improving Social Services Through Community Development. Deputy Mayor for Health and Human Services, Linda Gibbs Office of the Mayor New York City, September 2011. Agenda. Overview of NYC Government and Health and Human Services How Can Government Be Innovative?

E N D
Improving Social Services Through Community Development Deputy Mayor for Health and Human Services, Linda Gibbs Office of the Mayor New York City, September 2011
Agenda • Overview of NYC Government and Health and Human Services • How Can Government Be Innovative? • Overview of the Center for Economic Opportunity • Overview of the Young Men’s Initiative • Role of Non-Profits in Delivering Results • Public/ Private Partnerships • Accountability, Measurement and Evaluation • Q& A
The Scope of Health and Human Services in NYC 9 City Agencies Department of Homeless Services Human Resources Administration Department for the Aging Administration for Children’s Services Department of Correction Department of Probation Department of Health and Mental Hygiene Health and Hospitals Corporation Office of the Chief Medical Examiner $20 Billion Budget Over 35,000 Staff +
Developing a Process for Innovation • Identify Issues • Gather Research • Consult Experts/Engage Stakeholders • Create Solutions • Identify Hurdles • Identify Success and Measure Results • Implement • Manage by the Numbers
New Anti-Poverty Agenda • Mayor Bloomberg established the Center for Economic Opportunity in December 2006 to: • Implement, monitor, & evaluate the City’s ambitious new anti-poverty agenda • $150 million Innovation Fund supports CEO’s efforts to pilot new anti-poverty programs • Requires that each program be evaluated • Develop New Measures • Created alternative to the outdated federal poverty measure • New measure reflects impacts of government assistance programs, such as the Earned Income Tax Credit • Test Conditional Cash Transfers • First five payments delivered in new program designed to test the effect of incentives on education, health, & employment activities
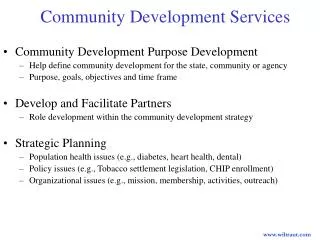
Selecting Neighborhoods: Methodology Gather data on key policy indicators Identify neighborhoods of interest Identify local resources with capacity to serve Education Outcomes Educational attainment (less than high school) Health Outcomes Teen birth rates, Homicide-related deaths Economic Opportunity CEO poverty rate, Disconnection rate Criminal Justice Stop and Frisks, Probationer Population, Parole Population Existing City Programs City agency-run programs and initiatives already operating in selected areas High-Quality Service Providers Organizations with history of strong performance and outcomes Geographic Proximity Organizations operating in selected neighborhoods of interest Placeholder for final NYC map showing neighborhood data overlaid to identify neighborhoods of interest Note: Data was mapped to the most detailed geographic unit available (Zip Codes, Community Districts or NYPD Precincts) depending on each department’s data. Neighborhoods were identified using the Department of Information Technology and Telecommunication’s NYCityMap tool, which uses the United Hospital Fund’s 42 neighborhood designations. 6
Center for Economic Opportunity (CEO) Strategies Workforce development: supporting training, job retention and career advancement for low-income workers Disconnected youth: Re-engaging adolescents who are not working or in school Financial empowerment and asset development: helping low-income individuals maximize their resources Conditional Cash Transfers: incentive-based strategies that provide rewards when individuals meet targets
Poverty (%)Percentage of CD residents living in poverty (CEO measure) 10 6 3 2 8 15 19 4 5 7 38 1 9 *Community Districts marked with an asterisk represent those that are among the top ten CDs when measured by both percentage and actual number of residents living in poverty. Note: These neighborhood rankings represent Community Districts, outlined in red, sorted by the percentage of residents (all ages, sexes) living below the CEO Poverty line. Source: Center for Economic Opportunity, 2006-2008 American Community Survey 8
Educational Attainment 7 9 4 8 10 2 1 5 3 35 6 Note: These rankings represent Community Districts by the percentage of 16-24 year old males with less than a High School diploma or equivalent level of education. Due to sample size, differences between the CDs are not statistically significant. Source: Center for Economic Opportunity 9
Births to Young Single Women 9 5 7 10 2 16 1 4 8 6 3 Note: These rankings represent Zip Codes, outlined in red, sorted by the number of 16-24 year old unmarried women that gave birth in 2008. Corresponding neighborhoods were identified using the United Hospital Fund’s 42 neighborhood designations. Source: NYC Department of Health and Mental Hygiene, Department of Information Technology and Telecommunications 47 10
Disconnected Youth (%)Percentage of 16-24 year old men disconnected from school and work 10 6 9 4 1 5 24 8 7 2 3 *Community Districts marked with an asterisk represent those that are among the top ten CDs when measured by both percentage and actual number of disconnected young men. Note: These neighborhood rankings represent Community Districts, outlined in red, sorted by the percentage of 16-24 year old men that are disconnected from education and employment. Even though we have combined three years of data in these estimates, the sample of male youth in each neighborhood is very small. This means that the neighborhood-level data should be treated as approximations and not precise estimates. Source: Center for Economic Opportunity 19 11
Homicide Deaths 7 5 29 8 28 6 3 10 52 4 1 2 9 Note: These rankings represent Zip Codes, outlined in red, sorted by the number of 16-24 year old males whose deaths were homicide-related. Corresponding neighborhoods were identified using the United Hospital Fund’s 42 neighborhood designations. Source: NYC Department of Health and Mental Hygiene, Dept. of Information of Information Technology and Telecommunications 12
CEO Programs: Teen Action Provides service learning programs for middle and high school students in high-poverty communities. Students develop community service projects to improve self-esteem, school performance, and to reduce risky behaviors and teen pregnancy. Outcomes: 68.1% of participants attend school more regularly; 69.1% get better grades in school; and 77.8% are less likely to engage in unprotected sex. Evaluation: Early implementation analysis found program model implemented with fidelity. Pilot Survey fielded in Spring ‘08, concluded program having positive effect in reducing risk behaviors. Full evaluation includes two comparison groups.
CEO Programs: CUNY ASAP Provides academic and economic support to help students complete Associate degrees in an accelerated manner. Outcomes: Two year graduation rate is 35% compared to traditional graduation rate of 21% in six years. Evaluation: Early Implementation analysis concluded program implemented with fidelity at all six CUNY campuses. Annual survey, exit survey and focus groups of graduates. Worked with CUNY OIRA to develop appropriate comparison group. Additional analysis includes propensity score matching and regression analysis of outcomes. Results available this fall.
CEO Programs: Jobs Plus • Place-based, work-focused initiative targeting all working-age residents in a development-saturation model. • Provides employment services coupled with rent incentives and activities supporting community support for work such as neighbor-to-neighbor outreach. • Piloted by MDRC in 6 cities in the late 1990’s. • Random assignment showed positive long-term earnings gains, and positive effects across diverse subgroups & locations. • Planned launch in October. On-going monitoring and early implementation assessment (MDRC) planned.
Leadership City of New York (CEO) Support Foundations & Partners Design MDRC & Seedco Evaluation MDRC Implementation Seedco & 6 CBOs Conditional Cash Transfers are incentive-based strategies that provide rewards when individuals meet targets. CEO Programs: Opportunity NYC Goals: • Poverty reduction (immediate) • Encourage and reinforce positive actions (short-term) • Break intergenerational cycle of poverty (long-term) Demonstrated Success: • Used in more than 20 countries • Proven to increase school enrollment, decrease school drop-out rates, and improve children’s health
The State of Black & Latino Youth • The citywide graduation rate is 68%, which marks a 17% increase since 2002. The 2009 four-year graduation rates for Black and Latino males was 46.5% and 45.3% • Of young men of color who did graduate in 2009, only 13% were deemed “college and career ready” • While the City’s probationers who were rearrested for a felony within a year dropped by 27% from 1999 to 2009, 84% of admissions to detention facilities are black and Latino males • 37% of Black males, ages 16-24, and 20% of Latinos are not participating in New York City’s labor force • Black and Latino male youth in New York City are twice as likely to experience frequent mental distress as their white peers
Young Men's Initiative (YMI) • Three-year action plan that will invest $127 million to support new programs and policies designed to breakdown barriers to success • The plan advances four areas where the disparities are greatest and the consequences most harmful: • Education • Justice • Employment • Health • Measure and evaluate the success of new program investments, policy and agency practice changes
YMI: Education Expanded Success Initiative: An in 40 schools to close the post-graduation achievement gap to help students be college and career ready Measure the performance of Black and Latino young men against that of their peers will appear on all school progress reports Reduce the disparities that exist in special education and suspensions
YMI: Justice • Support Justice Scholars and Justice Community programs to help court-involved youth explore career and education options • Establish AIM, a mentoring program for youth on probation in targeted neighborhoods • Support literacy services for pre-GED youth in newly created Department of Probation Neighborhood Opportunity Networks (NeONs) • Project Ceasefire, apublic health violence prevention model that focuses on the highest-risk communities and youth
YMI: Employment • Mayoral Executive Order will connect young people to official IDs to ease the process of applying for employment • Expand the Jobs Plus program by, whichremoves barriers to work for residents in public housing and helps connect them to jobs • Expand successful Young Adult Internship Program and Young Adult Literacy Program that connects young people to education and training while they are working • Expand public private partnerships to sustain and expand the summer youth employment program
YMI: Health • Comprehensive sex education for all middle and high schools as part of the mandated health curriculum • Launched the Fatherhood Initiative and hired first Citywide Fatherhood Services Coordinator • Establish criteria for teen-friendly clinics and create incentives for participation so more youth will have access to care • Creation of a training program through City Health and Hospitals Corporation to better prepare physicians, nurses, and other providers to work with adolescents
Role of Non-Profits in Delivering Results • Non-Profits are our direct service providers and our lifeline to targeted communities we are trying to serve. Our RFP process helps us to choose the best non-profits to provide the best programs. “ Effective public – private sector collaboration is often born out of necessity. For example, our nation has recently witnessed unprecedented public-private partnerships in the wake of terrorist attacks, natural disasters and other pressing public policy issues (e.g., healthcare, education). With no formal contracts in place to mandate or provide direction to or how private entities should respond or coordinate with public entities, the crises alone promote expediency for both sides to come together to solve a problem and establish order out of chaos” - NASCIO
Public-Private Partnerships Through Public Private Partnership: • Expanded Success Initiative: A $24 Million investment in 40 schools to close the post-graduation achievement gap to help students be college and career ready • Measure the performance of Black and Latino young men against that of their peers will appear on all school progress reports • Reduce the disparities that exist in special education and suspensions
Accountability and Oversight CEO YMI External Advisory Board Monthly meetings with Mayor Bloomberg and agency commissioners Monitoring and Evaluation Mayor’s Youth Leadership Council • Data and implementation studies used to improve program performance • Findings used to identify new needs & additional research questions • Outcomes used to inform resource allocations • Lessons Learned • Leadership • New Resources • Effective Management • Provider Capacity
CEO Evaluation • All Programs Assessed • Program-specific Evaluation Strategies Based on • Types of Assessment • Evaluation Partners • External Evaluators: Westat, Metis Associates, MDRC • City Agencies • In-house Evaluation Team • Data Availability • Implementation Status • Timing of Expected Outcomes • Knowledge of Intervention • Strength of Program Model • Level of Investment • Routine Management • Early Implementation / Outcome Study • Program / Topic Specific Study • Rigorous Evaluation
Q & A QUESTIONS?