Download
1 / 5
50 likes | 226 Vues
The Great Salt Lake as a P aleoclimate Indicator. Morgan Rosenberg John Solder. Rock Evidence from Cores. Percent Sand Lower lake level = higher sand concentration Dry Conditions Higher lake level = lower sand concentration Wet Conditions Percent Carbonate

E N D
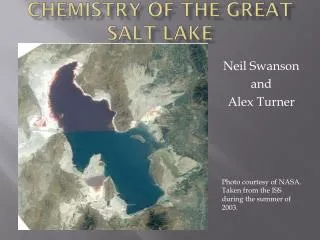
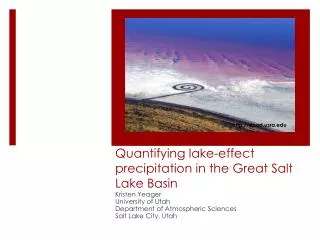
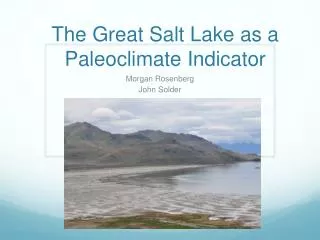
The Great Salt Lake as a Paleoclimate Indicator Morgan Rosenberg John Solder
Rock Evidence from Cores • Percent Sand • Lower lake level = higher sand concentration • Dry Conditions • Higher lake level = lower sand concentration • Wet Conditions • Percent Carbonate • Lower lake level = higher percentage of carbonate • Warmer and Drier Climate Conditions • Higher lake level = lower percentage of carbonate • Cooler Conditions • Charcoal – If present, wet climate Patrickson, 2010.
Global Climate Setting • Evidence that global climate change is synchronous with changes in glacial coverage • Ice Rafting into the North Atlantic 5-10 k.y.a. • World wide temperature abruptly increased at the end of each event • Lake regression U1, U2, U3, are correlated to ice rafting events c, b, a respectively. • The Stansbury ossicilation, post-Provo regression, and the post-Gilbert regression coincide with the H1, H2 Heinrich Events, and Younger Dryas, respectively. Oviatt, 1997.
Modeling Scenarios • Hot and Dry • Lake Level: 4176 ft • Cold and Wet • Lake Level: 4210 ft • Hot and Wet • Lake Level: 4202 ft • Cold and Dry • Lake Level: 4180 ft