Download
1 / 24
240 likes | 477 Vues
http:// epod .usra.edu. Quantifying lake-effect precipitation in the Great Salt Lake Basin. Kristen Yeager University of Utah Department of Atmospheric Sciences Salt Lake City, Utah. Introduction.

E N D
http://epod.usra.edu Quantifying lake-effect precipitation in the Great Salt Lake Basin Kristen Yeager University of Utah Department of Atmospheric Sciences Salt Lake City, Utah
Introduction • The Great Salt Lake Basin of the Intermountain West is one of the fastest growing regions of the United States. • Water resources are limited in the arid West. • It is essential to understand and quantify the sources of precipitation in order to plan for future water usage. • Many studies have been conducted on the synoptic and mesoscale processes associated with Great Salt Lake Effect, but none have tried to quantify the amount of precipitation produced.
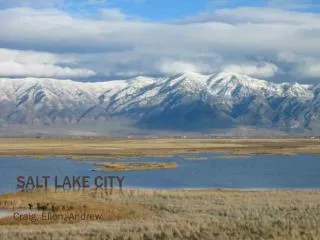
Introduction—Geography * KMTX Great Salt Lake Salt Lake Valley Wasatch Mountains Stansburys Oquirrhs Utah Lake
Introduction—Geography • Spans 4 states, encompassing 89,000 km2 • Most of Utah • Southwestern Wyoming • Eastern Nevada • Southeastern Idaho http://www.greatsaltlakeinfo.org
Objectives • To develop a technique to disaggregate daily precipitation data from gauges throughout the Great Salt Lake Basin for an improved estimate of precipitation produced by lake-effect storms • To produce a climatology of lake-effect precipitation that can be used to better understand the hydroclimate of the Great Salt Lake Basin.
Data • Coop station data came from Utah State University; coop hour of observation information obtained through NWS SLC WFO • SNOTEL data downloaded off NRCS website.
Data—Quality Control • Stations are eliminated if: • Full period of analysis unavailable (9/16/97-5/15/09) • Too many days are missing (>6%) • Too many lake-effect days are missing (>6%) • Ended with 31 coop stations • Number of SNOTEL stations • remained the same
Data—Quality Control • Missing data filled in using the normal ratio method: • Wi = ri2(ni – 2) / (1 – ri2) • Wi= weight of ithsurrounding station • ri = correlation coefficient of ith surrounding station • ni = number of observations used to calculate correlation coefficient • To compensate for differing observation times, only stations recording within 3 hours of each other could be used to help fill the missing data of the other.
Methods—Radar Disaggregation • Hourly precipitation observations are needed to quantify • lake-effect precipitation. • Gauge observations more reliable then radar-derived precipitation, but gauges are sparsely located and don’t record on an hourly time step. • Radar coverage is both spatially and temporally continuous. • Radar data is used to disaggregate the 24-hr precipitation observations into hourly observations. • Based on a 2010 article in the International Journal of Climatology by Marc Wüest and ChristophFrei
Methods—Radar Disaggregation • Radar reflectivity averaged over each hour of 24-hour • observation period. • Z-”S” algorithm of Z=75S2applied to estimate precipitation rate and amount for each hour. This algorithm is recommended for use during cool season snow events west of the continental divide (Vasiloff 2001). • Hourly radar estimates taken as a percent of the daily radar estimate to construct a daily distribution of precipitation. • Radar-derived distribution multiplied by 24-hour gauge observation to determine hourly amounts
Methods—Radar Disaggregation Disaggregated Precipitation Amount (24-hr. observation = 1.20 in.) Radar-Derived Precipitation Distribution Percent of Daily Precipitation Precipitation (inches) 1 2 3 4 5 6 7 8 9 10 11 12 13 14 15 16 17 18 19 20 21 22 23 00 1 2 3 4 5 6 7 8 9 10 11 12 13 14 15 16 17 18 19 20 21 22 23 00 Hour (UTC) Hour (UTC) • Radar determines distribution of precipitation • 24-hour gauge recording remains true 24-hour precipitation amount
Methods—KMTX Radar Full blockage Partial blockage No blockage
Methods—Verification • Two sites had reliable hourly observations going back to 1997 • KSLC—Salt Lake City International Airport • CLN—Alta Collins Vertical Cross Section of KMTX 0.5° Radar Tilt for CLN Vertical Cross Section of KMTX 0.5° Radar Tilt for KSLC Height MSL (km) Height MSL (km) 100 0 67 0 Horizontal Range (km) Horizontal Range (km)
Methods—Verification Radar Bias for Salt Lake City International Airport During Lake-Effect Events in. Radar Bias for Alta Collins During Lake-Effect Events in.
Methods—Verification 97-98 08-09 98-99 08-09
Results 4 Precipitation (inches) 10 0 Mar Apr May Feb Oct Nov Dec Jan Sep 2.66% 1.46% 4.72% 4.16% 2.34% 3.26% 2.90% 5.13% Precipitation (inches) 5.50% 6.22% 7.70% 5.96% 1.19% 1.22% 2.00% 0 Nov Mar Dec Jan Feb Apr
Results 50 Precipitation (inches) 3.0% 5.2% 11.0% 4.8% 5.1% 70 0 08-09 5.3% 97-98 5.1% 3.8% Winter 2.6% 6.6% 1.9% 4.1% 3.9% 8.6% Precipitation (inches) 5.9% 9.3% 5.8% 9.7% 12.7% 7.8% 4.8% 8.4% 13.1% 0 08-09 98-99 Winter
Results Frequency of Occurrence of >10 dBZ during Lake-Effect Events Courtesy of Steenburgh 2000
Conclusions • Radar disaggregation method underestimates during lake- • effect periods and overestimates during non lake-effect periods. • Both disaggregated amounts and hourly observations at the two verification sites indicate a bi-modal distribution of lake-effect contributions across wintertime months. • Lake-effect contribution varies from year to year. • Lake-effect precipitation contributes minimally to the overall wintertime precipitation of the Great Salt Lake Basin.
References Carpenter, David M., 1993: The Lake Effect of the Great Salt Lake: Overview and Forecast Problems. Wea. Forecasting, 8, 181–193. Di Luzio, Mauro, Gregory L. Johnson, Christopher Daly, Jon K. Eischeid, Jeffrey G. Arnold, 2008: Constructing Retrospective Gridded Daily Precipitation and Temperature Datasets for the Conterminous United States. J. Appl. Meteor. Climatol., 47, 475–497.doi: 10.1175/2007JAMC1356. Eischeid, Jon K., Phil A. Pasteris, Henry F. Diaz, Marc S. Plantico, Neal J. Lott, 2000: Creating a Serially Complete, National Daily Time Series of Temperature and Precipitation for the Western United States. J. Appl. Meteor., 39, 1580–1591.doi: 10.1175/1520-0450(2000)039<1580:CASCND>2.0.CO;2 Lall, U. and M. Mann, (1995), "The Great Salt Lake: A Barometer of Low-Frequency Climatic Variability," Water Resources Research, 31(10): 2503-2515. Steenburgh, W. James, Scott F. Halvorson, Daryl J. Onton, 2000: Climatology of Lake-Effect Snowstorms of the Great Salt Lake. Mon. Wea. Rev., 128, 709–727.doi:10.1175/1520-0493(2000)128<0709:COLESO>2.0.CO;2 Steenburgh, W. James, 2003: One Hundred Inches in One Hundred Hours: Evolution of a Wasatch Mountain Winter Storm Cycle. Wea. Forecasting, 18, 1018–1036.doi:10.1175/1520-0434(2003)018<1018:OHIIOH>2.0.CO;2 Thiros, S. A., and Manning, A. H., 2004, Quality and sources of groundwater used for public supply in Salt Lake Valley, Salt Lake County, Utah, 2001: U.S. Geological Survey Water- Resources Investigation Report 03-4325. Vasiloff, S. V., 2001: WSR-88D Performance in Northern Utah During the Winter of 1998-1999. Part II: Examples of Error Sources. National Weather Service Western Region Technical Attachment, No. 01-03. Wüest, M., Frei, C., Altenhoff, A., Hagen, M., Litschi, M. and Schär, C. (2010), A gridded hourly precipitation dataset for Switzerland using rain-gauge analysis and radar-based disaggregation. International Journal of Climatology, 30: 1764–1775. doi: 10.1002/joc