Download
1 / 17
170 likes | 377 Vues
10 th Annual CMAS Conference 24-26 th October, 2011. Evaluation of effects of stratospheric ozone to surface background ozone. Yun Fat Lam, Joshua Fu, Yang Gao* Daniel J. Jacob** Carey Jang and Pat Dolwick*** *The University of Tennessee, Knoxville **Harvard University

E N D
10th Annual CMAS Conference 24-26th October, 2011 Evaluation of effects of stratospheric ozone to surface background ozone Yun Fat Lam, Joshua Fu, Yang Gao* Daniel J. Jacob** Carey Jang and Pat Dolwick*** *The University of Tennessee, Knoxville **Harvard University ***Office Air Quality Planning and Standards (OAQPS), USEPA Oct 26, 2011
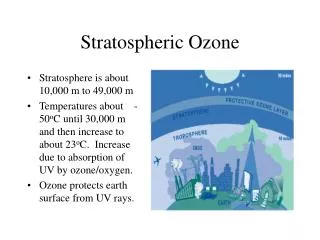
GEOS-Chem v8-02-03 configurations • Domain: Global simulation • Horizontal Grid Spacing: 2 ° x 2.5° • Horizontal Coordinate: Lat x Lon • Vertical Grid Spacing: 48 layers • Simulation Period: 2006 - 2008 • Meteorological Input: Assimilated meteorological data from NASA GEOS-5 Emissions as shown below:
Observation comparison in US - ozone • Ozone Network:CASTNET • Site Selection: 12 sites from Western US and12 sites from Eastern US • Summary Statistics: Western US (Avg. elevation: 2400 m)Eastern US (Avg. elevation: 500 m)
Pinedale, WY Great Smoky NP, TN Yellowstone NP, WY Horton Station, VA MDA8 ozone (both Eastern and Western sites) It is a seasonal average value from March to September The resolution used in the GEOS-Chem simulation is not fine enough to capture the MDA8 ozone at the bottom of the ridges. If not counting those sites, the bias range is ~ ± 5 ppbv
MDA8 ozone (both Eastern and Western sites) The GEOS-Chem under predicts the MDA8 ozone by 3.0 to 6.0 pbbv due to the coarse grid resolution. The interannual variation of MDA8 ozone is about 3.0 to 5.0 ppbv. The Western US has a higher interannual variation (5.0 ppbv) than the Eastern US (3.0 ppbv).
Study of US background ozone - 2006 • Confirmation of Intercontinental transport of air pollutants • Enhancement of background pollutants concentrations • Focus on Maximum Daily Average 8-hr (MDA8) ozone
MDA8 ozone in the Western US At the high elevation, 14.0ppbv of overall MDA8 ozone is contributed by anthropogenic emissions (about 25%). The average background is 40.0ppbv.
MDA8 ozone in the Eastern US At the low elevation, 25.0 ppbv of overall MDA8 ozone is contributed by anthropogenic emissions (about 50%). The average background is 24.0 ppbv.
Background ozone in the spring The background ozone at the elevated areas is much higher than in the low areas (differences in the transport of stratospheric ozone). Additional 8.0 to 11.0 ppbv is observed in the Western background.
Background ozone in the summer In the summer, the background ozone is increased by 3.0 ppbv in the Western US due to the increase in temperature, while it decreased by 5.0 ppbv in the Eastern US. The contribution from anthropogenic emissions can reach as hig as 38.0 ppbv predicted in the Northeastern US (see the blue plot) in summer.
Overall background ozone • The emission impacts from Canada and Mexico only showed localized impacts. • The impact from Asia shows a regional/continental impact • (3 – 5 ppbv increase in MDA8 ozone).
Development of GEOS-Chem to CMAQ Initial and boundary conditions module (Geo2CMAQ) • First version – 2005 to 2006 (version 1.1-1.2) • Chemical Mapping Table for CB-IV and SPARC-99 Mechanisms (EPA, 2003) • Horizontal Interpolations between gridded models • Vertical Interpolation between layers • Added Chemical Mapping Table for CB-05 and AE3 species • Second version – 2008 (version 2.1) • Added tropopause determining algorithm to remove stratospheric effects from GEOS-Chem (AE4) • Newest version – 2010 (version 2.2) • Add new mapping table for CB05-AE5. • Restructure to accept output from GEOS-Chem v8-02-01.
Systematic flowchart of GEOS2CMAQ (a) IC Examples of CMAQ IC and BC files (2006 July 01 at 0:00 GMT at surface) Lam and Fu [2010]
Summary • The interannual variation in MDA8 ozone is about 3.0 to 5.0 ppbv among those three years. • The Western US shows a much higher background ozone than the Eastern US, which is highly related to the ozone transport from stratosphere. • The impact from Asia emissions is regional or continental. The average impact is about 3 – 5 ppbv. • The emission impacts from Canada and Mexico only showed localized impacts.
Thanks! Questions? This research was supported by USEPA and an allocation of advanced computing resources provided by the National Science Foundation. The computations were performed on Kraken at the National Institute for Computational Sciences (http://www.nics.tennessee.edu/).