GDP
GDP. Published by: Bureau of Economic Analysis Frequency: Quarterly Period Covered: prior quarter Volatility: Moderate Market significance: very high Web site: www.doc.gov How do markets react? GDP ↑ > Stock market ↑ GDP ↑ > Bond market ↓ GDP ↑ > Dollar appreciates.

GDP
E N D
Presentation Transcript
GDP • Published by: Bureau of Economic Analysis • Frequency: Quarterly • Period Covered: prior quarter • Volatility: Moderate • Market significance: very high • Web site: www.doc.gov • How do markets react? GDP ↑ > Stock market ↑ GDP ↑ > Bond market ↓ GDP ↑ > Dollar appreciates
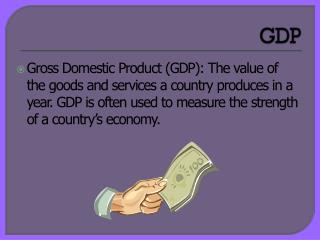
Some details: - best measure of economic activity - 3 estimates every quarter: a) Advance report: first month of the quarter. It is based on consumption information and some information on the other components of GDP. b) Preliminary report: second month of the quarter, includes almost all information. c) Revised (or final) report: third month of the quarter, includes all information.
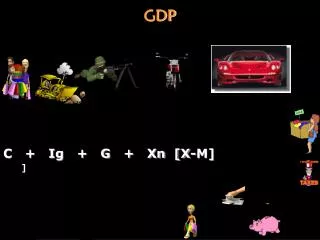
- The GDP report contains two estimates of real GDP 1. Built from the final demand categories: C+I+G+NX 2. Built from the income side: Personal income and corporate profit by construction 1 = 2
- The GDP report contains information about inflation: 1. Implicit deflator: measures a combination of price changes and changes in the composition of GDP. Not a pure measure of inflation. 2. Fixed-weight deflator: provides a measure of price changes for a given basket of goods and services. It is a pure measure of inflation. 3. Chain weighted price deflator: the index allows the quantity of purchase-weights to vary over time. Hence, real output is based on contemporaneous spending patterns.
- Note that it is possible to use information on monthly indicators to forecast GDP EX. Personal consumption expenditures: -Durable goods -Non-durable goods - Services - Keys to interpreting the GDP report: a) Pay close attention to inventory changes, the behavior of inventories has significant implications for future growth.
b) Focus upon the GDP chain-weighted price index as the most comprehensive measure of prices in the economy. It is a more comprehensive price indicator than the CPI or the PPI. c) Look at the pace of exports and imports. It has implications for the exchange rate market. d) Keep in mind that, traditionally, revisions to the GDP figures have a significant impact on financial markets.
Statistical Analysis Variables: GDP: Real GDP measured in billions of chained 2000 dollars. Source: Bureau of Economic Analysis. Stock market measure: Dow Jones Average. Source: www.djindexes.com FED announcement dates: binary variable, assumes the value of 1 in any period when the FED made a policy announcement and 0 otherwise. Source: Federal Reserve Period of Analysis: 1990:I-2003:IV
Graphic relationship between GDP and the Stock Market Levels
Descriptive Statistics LOG(DJ) LOG(GDP) Mean 7.547097 9.053289 Median 7.623849 9.048208 Maximum 8.106940 9.268619 Minimum 6.782985 8.859477 Std. Dev. 0.425978 0.132335 Skewness -0.221121 0.000139 Kurtosis 1.505406 1.557901 Jarque-Bera 5.668577 4.852514 Probability 0.058760 0.088367 Sum 422.6375 506.9842 Sum Sq. Dev. 9.980149 0.963188 Observations 56 56 Correlation .94
Regression Analysis (Long Run) Dependent Variable: LOG(DJ) Method: Least Squares Date: 04/10/04 Time: 20:15 Sample: 1990:1 2003:4 Included observations: 56 Variable Coefficient Std. Error t-Statistic Prob. C -19.72734 1.396976 -14.12146 0.0000 LOG(GDP) 3.012655 0.154290 19.52596 0.0000 FED -0.077969 0.049149 -1.586392 0.1186 R-squared 0.875937 Mean dependent var 7.547097 Adjusted R-squared 0.873640 S.D. dependent var 0.425978 S.E. of regression 0.151423 Akaike info criterion -0.90241 Sum squared resid 1.238166 Schwarz criterion -0.83008 Log likelihood 27.26762 F-statistic 381.2633 Durbin-Watson stat 0.257150 Prob(F-statistic) 0.000000
Regression Analysis (short run) Dependent Variable: DLOG(DJ) Method: Least Squares Date: 04/18/04 Time: 20:00 Sample(adjusted): 1990:2 2003:4 Included observations: 55 after adjusting endpoints Variable Coefficient Std. Error t-Statistic Prob. C 0.014347 0.020774 0.690620 0.4929 DLOG(GDP) 2.127120 1.866384 1.139701 0.2596 FED -0.019682 0.020970 -0.938601 0.3523 R-squared 0.043835 Mean dependent var 0.019761 Adjusted R-squared 0.007059 S.D. dependent var 0.077726 S.E. of regression 0.077452 Akaike info criterion -2.225328 Sum squared resid 0.311934 Schwarz criterion -2.115837 Log likelihood 64.19652 F-statistic 1.191955 Durbin-Watson stat 2.265988 Prob(F-statistic) 0.311785
Discussion of the Results • The graphic analysis suggests that there exists a positive relationship between GDP and the performance of the stock market. • This relationship is confirmed by the correlation coefficient. • The results of the long-run regression analysis indicate that the response of the stock market to changes in GDP is positive and significant. In addition, announcements by the FED show a negative relationship with stock market performance. However, these results are not sustained in the short run.