GDP
GDP. Gross Domestic Product. Macroeconomics:. Measures economic performance on a large scale (the BIG picture!) Economists use a variety of economic data, or “indicators”, to measure an economy’s health. Gross Domestic Product Inflation Rate Unemployment Rate.


GDP
E N D
Presentation Transcript
GDP Gross Domestic Product
Macroeconomics: • Measures economic performance on a large scale (the BIG picture!) • Economists use a variety of economic data, or “indicators”, to measure an economy’s health. • Gross Domestic Product • Inflation Rate • Unemployment Rate
GDP During the Great Depression Thousands of businesses – like this small shop in Eastport, Maine – failed or went bankrupt during the Great Depression. • What is happening in this photograph? • What interesting details do you see in this photograph? • What does this image reveal about consumer spending and business from 1929-1942? • What economic data might you use to explain what you see in the photograph?
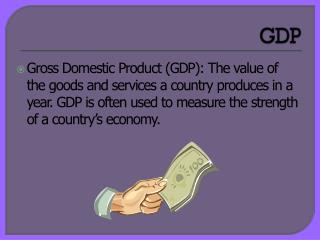
What is the GDP??? • The market value of all final goods and services produced within a country during a given period of time. • In the U.S., GDP is the standard measure of the nation’s total production. 3 apples@ $1 each = $3.00 GDP= 2 hair cuts @ $15 each= $30.00 $33.00
Nominal GDP: • GDP measured in current dollars Real GDP: • GDP measured in constant dollars • Allows for year-to-year comparison Per-Capita GDP: • GDP per person • Measures a society’s standard of living
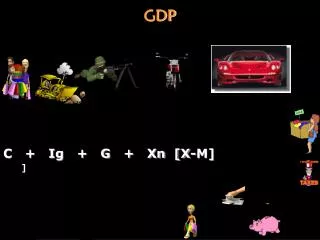
Calculating GDP: • Add up the market value of all FINAL goods and services produced in a country in a year. • Net Exports (NX): Spending by people abroad on U.S. goods and services (exports) minus spending by people in the U.S. on foreign goods and services (imports). • Consumption (C): Spending by households on goods and services. Includes spending on things such as cars, food, and visits to the dentist. Makes up 2/3 of GDP spending. • Investment (I): Spending by businesses on machinery, factories, equipment, tools, and construction of new buildings. • Government (G): Spending by all levels of government on goods and services. Includes spending on the military, schools, and highways.
Example: This diagram shows U.S. spending in 2007 on the four components used to calculate GDP. The figures are in billions of dollars. Note that household consumption is by far the largest component. Note also that net exports – exports minus imports – is a negative number. This indicates that Americans spent more on imports than they received for exports that year.
GDP does NOT include: • Intermediate goods • Financial resources (stock, etc.) • Used goods • Household and volunteer work • Underground economy (informal and illegal exchanges: drugs, black market, etc.) ***It only includes things in which the MARKET SALE can be accounted for***
As GDP Increases, So Does… • Education & Literacy Rates • Health and Life Expectancy • Standard of Living Target Growth Rate = 3-5% Per Year
Let’s practice looking at some data… Based on what you know about GDP and how it’s determined, what might explain the decline in GDP before 1933? During which of these years was real GDP growth the lowest? The highest? What might explain its fluctuations between 1933 and 1940? What might explain its increase after 1940?
Based on these real GDP and real GDP growth data, what generalizations can you make about the health of the U.S. economy during the Great Depression? How do these GDP data help to explain what you see in the photograph?