Download
1 / 26
260 likes | 407 Vues
AISD School Inequities Project. Amanda Aguirre, University of Texas Laura Avila, University of Texas Ariel Kay, Austin Voices Austin Voices for Education and Youth. This presentation advocates for the right of all students, regardless of their neighborhood, to a quality education.

E N D
AISD School Inequities Project Amanda Aguirre, University of Texas Laura Avila, University of Texas Ariel Kay, Austin Voices Austin Voices for Education and Youth
This presentation advocates for the right of all students, regardless of their neighborhood, to a quality education. We define a quality education as one that adequately prepares young people for higher education, citizenship, and the workforce.
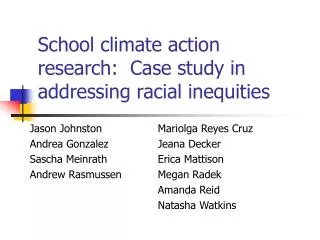
Focus The focus of the School Inequities Project is to analyze the disparity in how each high school prepares their students for higher education within the Austin Independent School District We are highlighting disparity in order to bring about equitable change within our school district
College Readiness Indicators • College Readiness Indicators from the Texas Education Agency Academic Excellence Indicator System from 2006-2007 school year. Percent of College Ready Graduates • Anderson 71% • Bowie 57% • McCallum 55% • Johnson 55% • Austin 53% • Garza 47% State 35% • Crocket 33% • Akins 28% • Travis 18% • Reagan 18% • Lanier 17% • Johnston 12%
College Readiness Indicators • After Ranking the 12 AISD high schools based on the percentage of College Ready Graduates we discovered 6 fell above and 6 fell below the state average. • We decided to focus on 4 high schools: Anderson, Austin, Akins, and Reagan. • Anderson ranked #1 with 71% of graduates being college ready while Reagan Ranked #10 with 18% being college ready. • Austin ranked #5, above the state average, with 53% college ready graduates while Akins ranked 8, below the state average, with 28% percent college ready graduates. • The four schools represent the disparity in preparation of students for higher education within AISD.
College Readiness Indicator: Advanced Placement and International Baccalaureate testing data
Climate Surveys • In addition to analyzing College Readiness Indicators we also looked at the school environment. We contrasted the overall Academic Environment, Behavioral Environment, Adult/Student interactions, and the Physical Environment of each high school. • We compiled our information using the Climate Survey results that AISD gathers from students every year because we feel students’ opinions are a primary resource in distinguishing a quality education. • We felt it was important to look at a school’s climate in order to better understand some of our findings. • The following information is just a brief overview and we recommend exploring it further.
Academic Environment • For this section we sampled 3 questions from the Climate Surveys: • “My teachers expect me to do my best work” • “My teachers challenge me to do better” and • “I feel/felt well prepared for the TAKS test” • We compared the 4 schools side by side and charted the progress that schools have made. • Overall, the schools all made improvements from the 2005-2006 school year to the 2006-2007 school year.
Raising Red Flags • One aspect we highlighted is that students at Anderson, Austin, and Akins made significant improvements in, while Reagan experienced a decrease in, perception of expectations. • Reagan experienced only a minor increase in the category “my teachers challenge me to do better,” while Anderson, Austin, and Akins experienced a more dramatic increase in results. • It may be beneficial to explore some of the programs and/or resources that Anderson, Austin and Akins are offering that contributed to these results. We also find it necessary to investigate what may contribute to the lack of improvement at Reagan High School.
TAKS Testing • However, the one area where schools did not make significant improvements, with the exception of Austin, was in the “I feel/felt well prepared for the TAKS test” item. • Since the TAKS test is designed to be an indicator of College Readiness, can determine whether a student passes a grade level or graduates, and affects whether a school faces closure, students need to feel confident that they are “well prepared for the TAKS test”.
Behavioral Environment • Respect contributes to a quality environment in which students can achieve. At Austin Voices for Education and Youth we maintain the belief that all students should feel respected and comfortable with the way their classmates treat them. • As a partner of the district in High School Redesign, the students of Austin Voices have have suggested a 5th “R” – RESPECT, be added to the now 4 “R’s” of High School Redesign. • We would like to point out that every school made significant improvements in the item “I am happy with the way my classmates treat me,” although Reagan results are still behind in comparison to the other high schools.
Physical Environment • The physical environment is a representation of the overall atmosphere of a school. It is a source of pride and the first impression visitors get. • We have drawn the conclusion that the physical environment of a school contributes to students’ overall success. • We looked at the item “This school is clean” and found while all schools improved Akins and Reagan showed the smallest amount of improvement. Amongst the other schools Reagan fell the farthest below the AISD average.
Overall Climate Survey Results • This section of our presentation was meant to serve as a window to see the “bigger picture.” In looking at the data you can see that overall: • Anderson and Austin fell at or above the AISD High School average. • Akins responses varied from above the average to just below the average. • Reagan was the only high school to experience a decrease in agreement to the questions we analyzed and it almost consistently fell below the high school averages. • While we can not accurately say how these factors contribute to college readiness success, we can point out that these factors are indeed in line with our rankings of the 4 high schools.
We conducted a survey at the four high schools concerning preparation of students for higher education. We chose quotes that represented the majority of responses from each school. Here are some of their thoughts… Do you feel prepared to enter into a college environment? Why? • “Yes, because I believe the education at Anderson sets high standards to prepare everyone.” -Senior at Anderson • “Yes, we have plenty of high level classes and similar assignments.” -Junior at Austin • “Yes, because as you get older, the classes get harder.” -Student at Akins • “Yes, but I’ll take 1 step at a time.” -Junior at Reagan
Conclusion We have high lighted disparities within AISD and we emphasize that in order to attain equity, student voices and needs must be heard. Through raising awareness of these disparities in our city we look to ignite positive change. Members of our community can work together to ensure that students, regardless of their demographics or school, are adequately prepared to succeed in higher education, citizenship, and the work force.
For More Information about the School Inequities Project: • Contact: • Amanda Aguirre a.aguirre@mail.utexas.edu • Laura Avila laura.v.avila@mail.utexas.edu • Ariel Kay akay@austinvoices.org Austin Voices for Education and Youth 512-450-1880