Risk, Uncertainty, and Sensitivity Analysis
180 likes | 597 Vues
Risk, Uncertainty, and Sensitivity Analysis. How economics can help understand, analyze, and cope with limited information. What is “risk”?. Can be loosely defined as the “possibility of loss or injury”. Should be accounted for in social projects (and regulations) and private decisions.

Risk, Uncertainty, and Sensitivity Analysis
E N D
Presentation Transcript
Risk, Uncertainty, and Sensitivity Analysis How economics can help understand, analyze, and cope with limited information
What is “risk”? • Can be loosely defined as the “possibility of loss or injury”. • Should be accounted for in social projects (and regulations) and private decisions. • We want to develop a way to describe risk quantitatively by evaluating the probability of all possible outcomes.
Attitude toward risk • Problem: Costello likes to ride his bike to school. If it is raining when he gets up, he can take the bus. If it isn’t, he can ride, but runs the risk of it raining on the way home. • Value of riding bike = $2, value of taking bus = -$1. • Value of riding in rain = -$6.
Costello’s options & the “states of nature” • Costello can either ride his bike or take the bus. • Bus: He loses $0 (breaks even). • Bike: Depends on the “state of nature” • Rain: $2 - $6 = -$4. • No rain: $2 + $2 = $4.
Probabilities & risk attitude • Pr(rain)=0.5. • Costello’s expected payoffs are equal: • Bus: $0. • Bike: .5*(-4) + .5*(4) = $0. • If he: • Always bikes: he’s a risk lover • Always buses: he’s risk averse • Flips a coin: he’s risk neutral • His behavior reveals his risk preference.
Risk attitudes in general • Generally speaking, most people risk averse. • Diversification can reduce risk. • Since gov’t can pool risk across all taxpayers, there is an argument that society is essentially risk neutral. • Most economic analyses assume risk neutrality. • Note: may get unequal distribution of costs and benefits.
Expected payoff more generally • Suppose n “states of nature”. • Vi = payoff under state of nature i. • Pi = probability of state of nature i. • Expected payoff is: V1p1+V2p2+… • Or S ViPi
Example: Air quality regulations • New air quality regulations in Santa Barbara County will reduce ground level ozone. • Reduce probability of lung cancer by .001%, affected population: 100,000. • How many fewer cases of lung cancer can we expect?…about 1 • .00001*100,000 = 1.
Example: Climate change policy • 2 states of nature • High damage (probability = 1%) • Cost = $1013/year forever, starting in 100 yrs. • Low damage (probability = 99%) • Cost = $0 • Cost of control = $1011 • Should we engage in control now?
Control vs. no control (r=2%) • Control now: high cost, no future loss • Cost = $1011 • Don’t control now: no cost, maybe high future loss: • If high damage = 1013[1/(1.02100) + 1/(1.02101) + 1.(1.02102) + … ] • = (1013/(.02))/(1.02100) = $7 x 10¹³ • If no damage = $0.
Overall evaluation • Expected cost if control = $1011 • Expected cost if no control = • (.01)(7 x 10¹³) + (.99)(0) = $7 x 10¹¹ • By this analysis, should control even though high loss is low probability event.
Value of Information • The real question is not: Should we engage in control or not? • The question is: Should we act now or postpone the decision until later? • So there is a value to knowing whether the high damage state of nature will occur. • We can calculate that value…this is “Value of information”
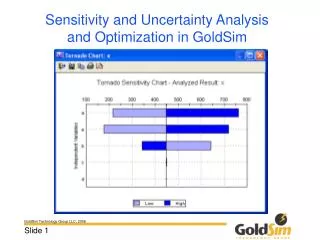
Sensitivity Analysis • A method for determining how “sensitive” your model results are to parameter values. • Sensitivity of NPV, sensitivity of policy choice. • Simplest version: change a parameter, re-do analysis (“Partial Sensitivity Analysis”)
More sophisticated sensitivity • The more nonlinear your model, the more interesting your sensitivity analysis. • Should examine different combinations. • Monte Carlo Sensitivity Analysis: • Choose distributions for parameters. • Let computer “draw” values from distn’s • Plot results